An Unhealthy Market
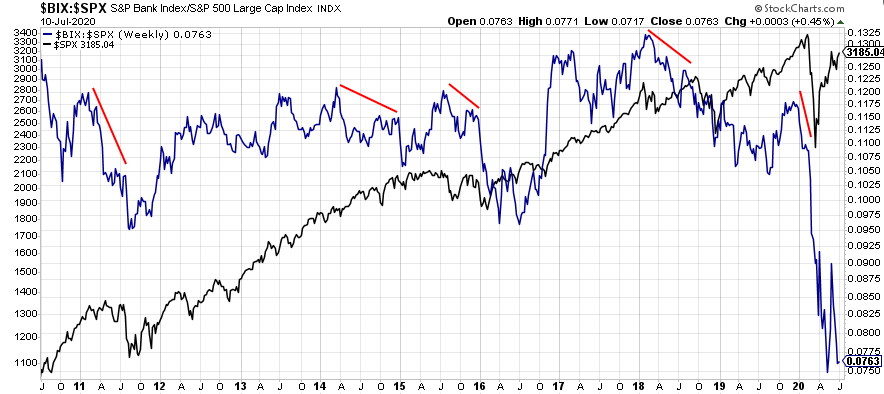
Looking at the banks relative to the broader equity markets is generally a good indicator for the health of the markets and the economy. A healthy, and thus well performing banking sector is a sign of a strong economy. Likewise, an underperforming banking sector is usually indicative of an unhealthy economy and a stock market that may be ready to roll over.
The continued rally of the S&P 500 has not been confirmed by the banking sector. Whilst the S&P is yet to take out its June highs, the banks have diverged in dramatic fashion since and have gone on to make new relative lows.

Source: StockCharts.com
Looking at this relationship over a longer time frame shows that historically, when the banks relative to the major indices diverge in such a bearish fashion, the preceding months’ performance is generally unfavourable.
Source: Stockcharts.com
We have seen a similar divergence take place in the local market, whilst not to the same extreme as within the US.
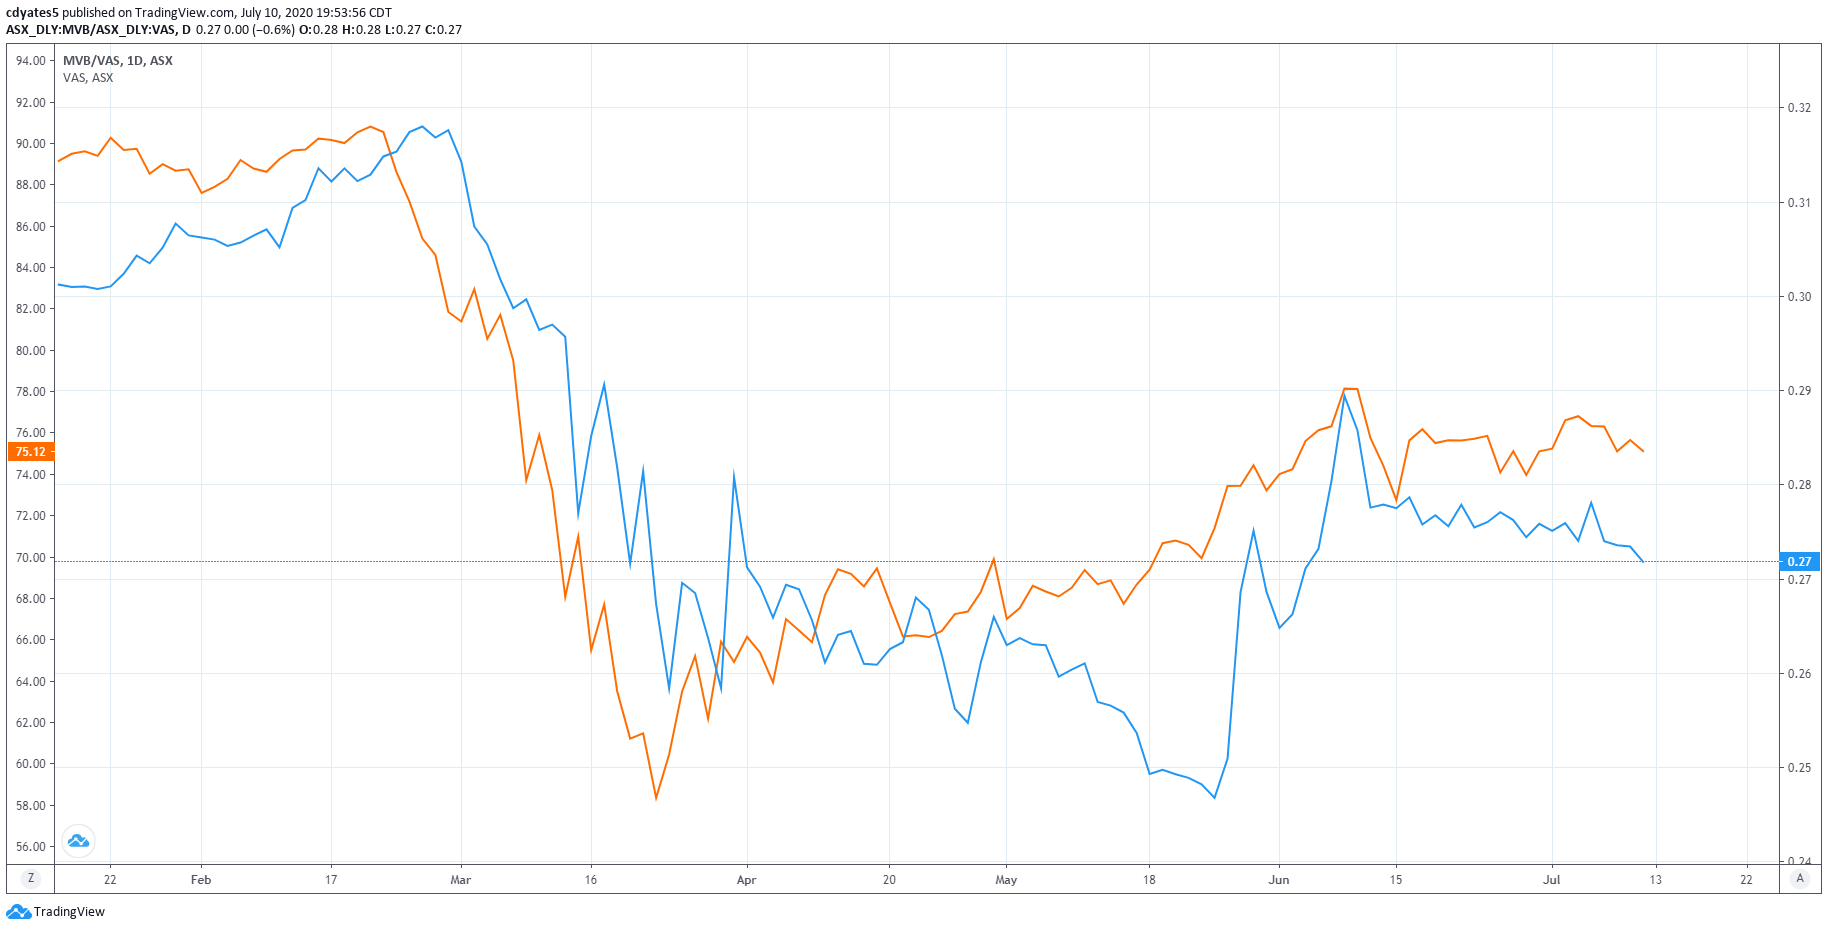
Source: TradingView.com

Source: TradingView.com
Furthermore, similar divergences in breadth as measured by the equal weight indices relative to the market-cap weighted indices have emerged of late, suggesting the markets are becoming primarily driven by the larger and more prominent names (i.e. the FANG stocks).
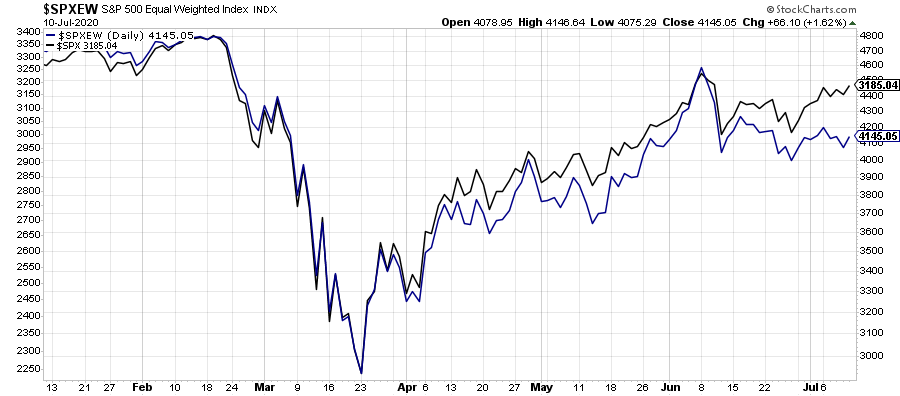
Source: StockCharts.com
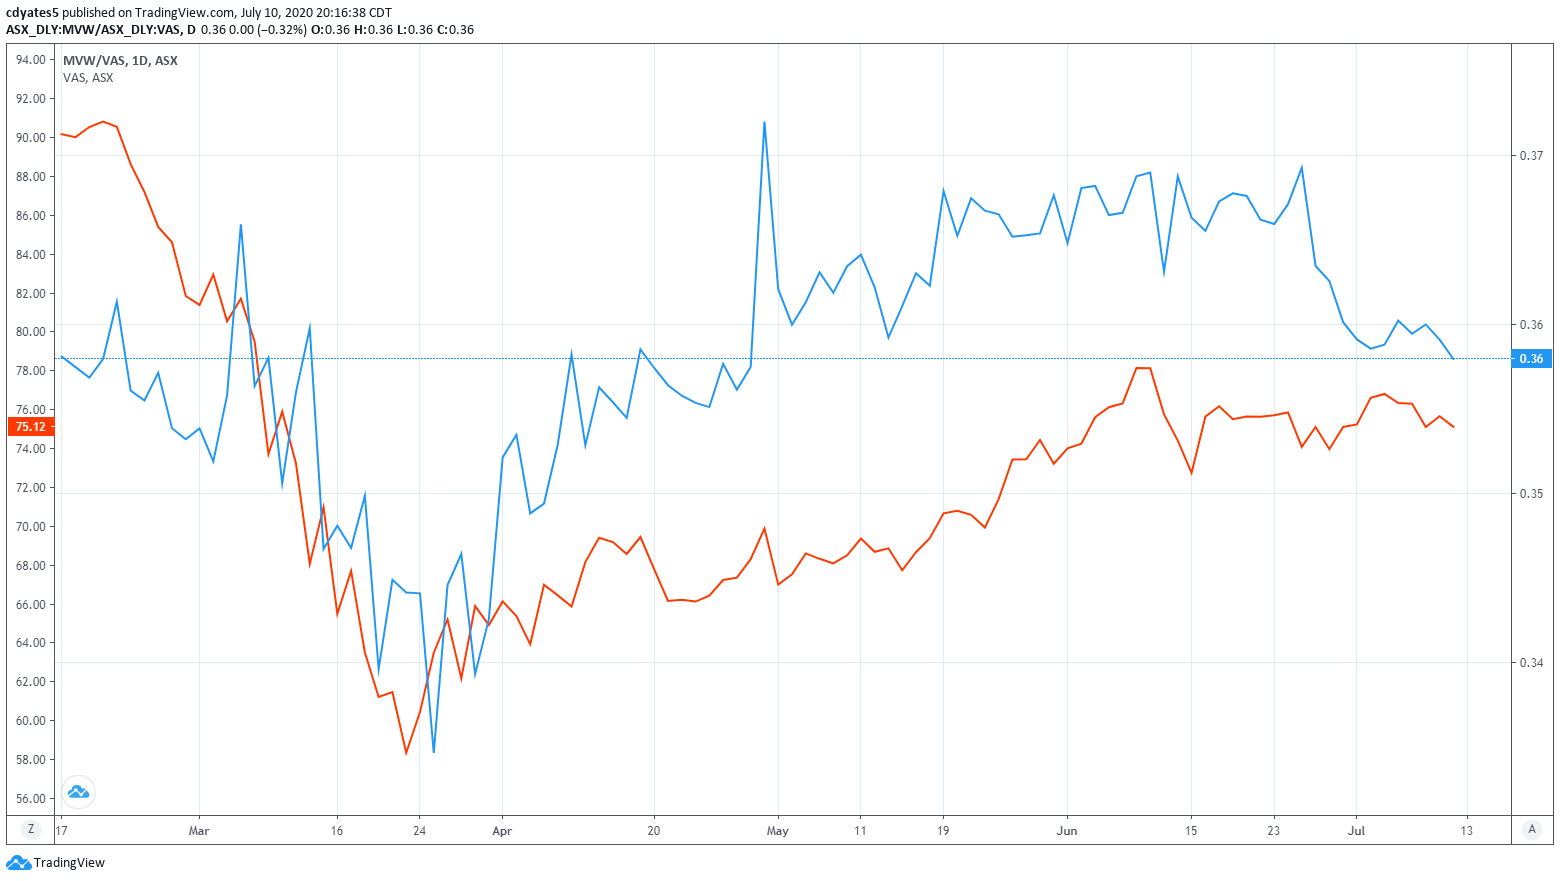
Source: TradingView.com
What’s perhaps most relevant to the markets these days and behind their inability to sustain this rally (outside of the Nasdaq) is the Fed’s balance sheet. The rate of expansion of their asset purchases is beginning to rollover, largely consisting of the Fed winding back their Repurchase Agreements and Dollar Swap Lines. Whilst the Fed has not reduced their buying of Treasuries and Mortgage Backed Securities, this reduced level of support in the overnight repo market and supply of dollars to foreign central banks does result in a reduced level of liquidity.

Source: St. Louis Fed
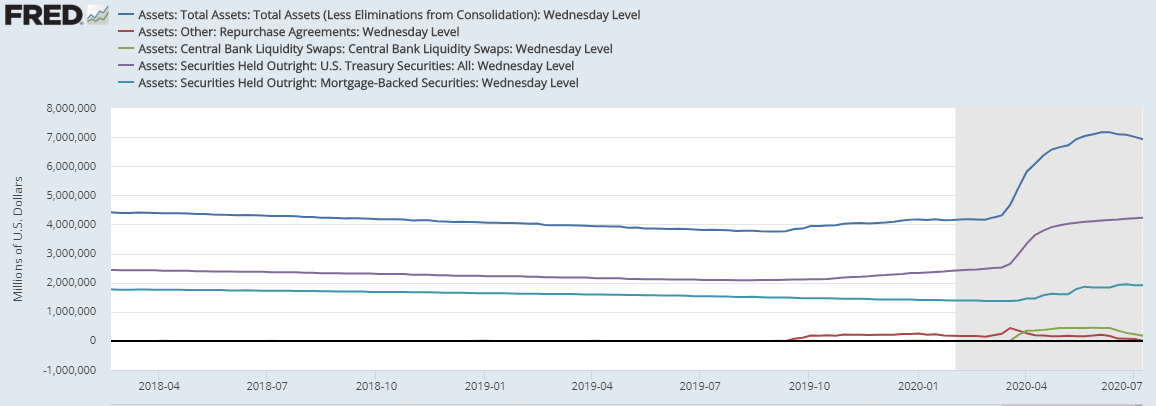
Source: St. Louis Fed
As the markets these days are effectively driven by flows and liquidity, and slight reduction of the latter since the beginning of June may be beginning to take its toll. As I have discussed in the past, the excess liquidity in the markets (measured as Fed assets net of treasury issuance) tracks the performance of the S&P 500 fairly closely. However, as a result of the Fed’s monetisation of the treasury issuance the US treasury has accumulated an incredible amount of ammunition, as measured by the US Treasury General Account, whose balance is now roughly $1.6 trillion, a four-fold increase from 12 months ago.
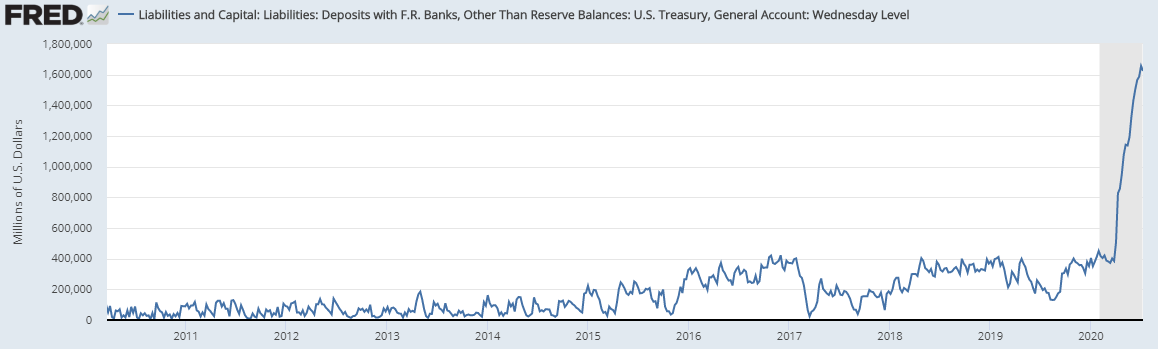
Source: St. Louis Fed
Despite record valuations along with an unhealthy economy and equity market, such immediate firepower available to the government and the “unlimited” quantitative easing capacity of the Fed, this may put somewhat of a floor in the market, at least until the election later this year. This is a market where I would not be surprised if we were to test the March lows, nor would I be surprised if the S&P were to take out the February highs.