Market Outlook
One thing I have been pondering lately is whether or not I should reduce my tail hedging position. Whilst I am still heavily bearish on a fundamental basis over the medium term, on a technical basis we are in an uptrend.
I have mentioned previously how it is the monetary stimulus and passive flow of monies that is behind the recent rally and represent the primary driver of markets these days. Indeed, what is no surprise is that the market strength throughout July occurred at the same time the Fed again began the expansion of their balance sheet. This follows from the contractionary trend we saw in June.
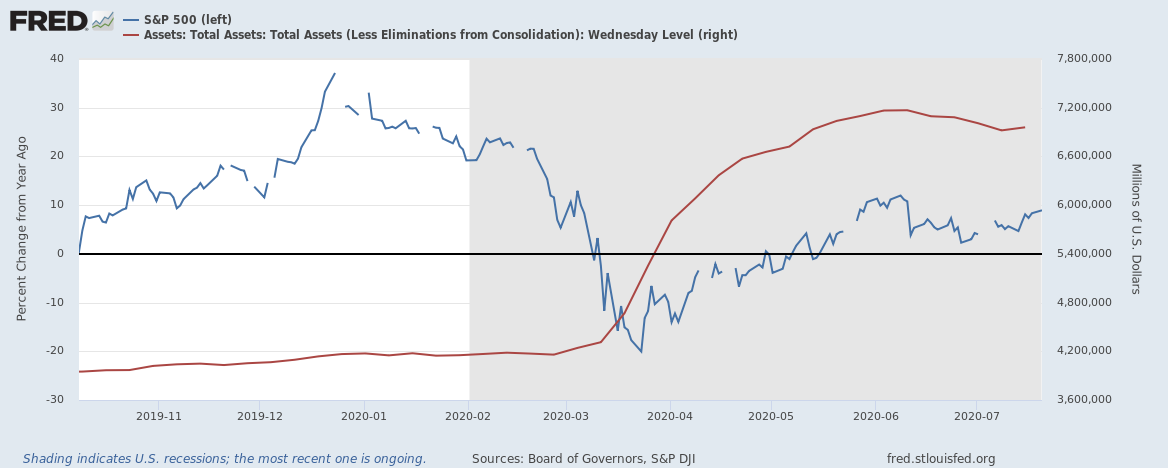
Source: St. Louis Fed
Turning to the technical’s of the S&P 500, we have recently seen a daily 9-13-9 DeMark sequential sell signal, along with a small divergence in momentum as measured by RSI.
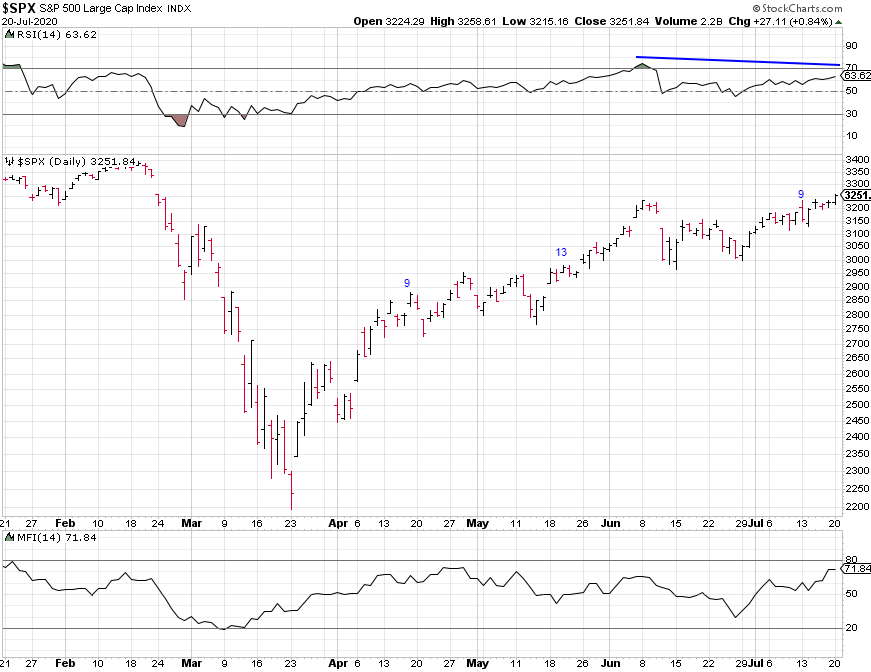
Source: StockCharts.com
The daily chart of the Nasdaq 100 paints a bleaker picture. In the process of rallying to new all time highs, the index has formed a bearish wedge pattern accompanied by negative divergences in both RSI and Money Flow. A break below the lower trendline would certainly be bearish.
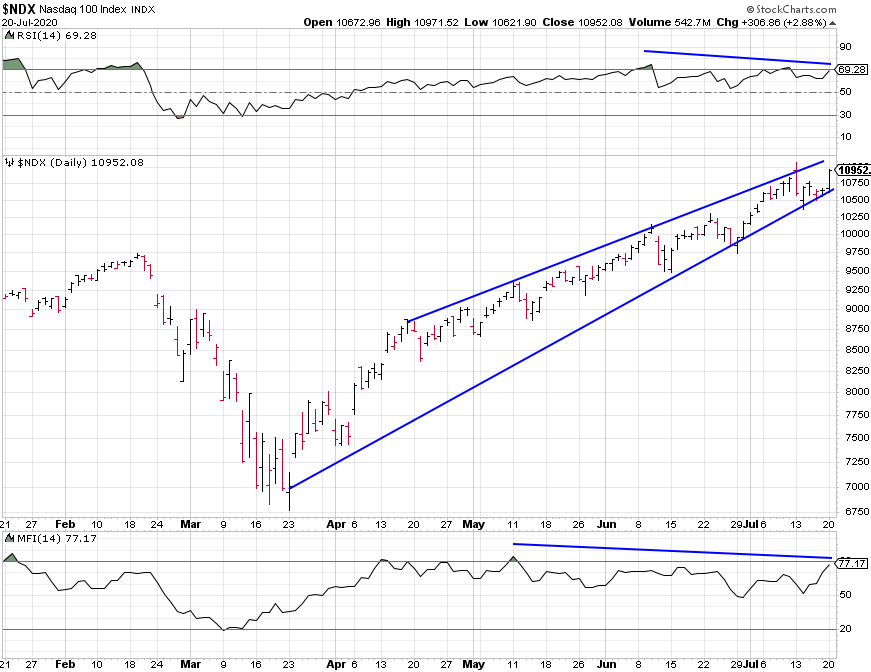
Source: StockCharts.com
Looking at the weekly chart of the Nasdaq 100 tells us that momentum peaked during the February highs, Money Flow on the other hand has confirmed the new high, similar to what we saw in April 2019 and January of this year, although you could argue there is a minor bearish divergence in the indicator.
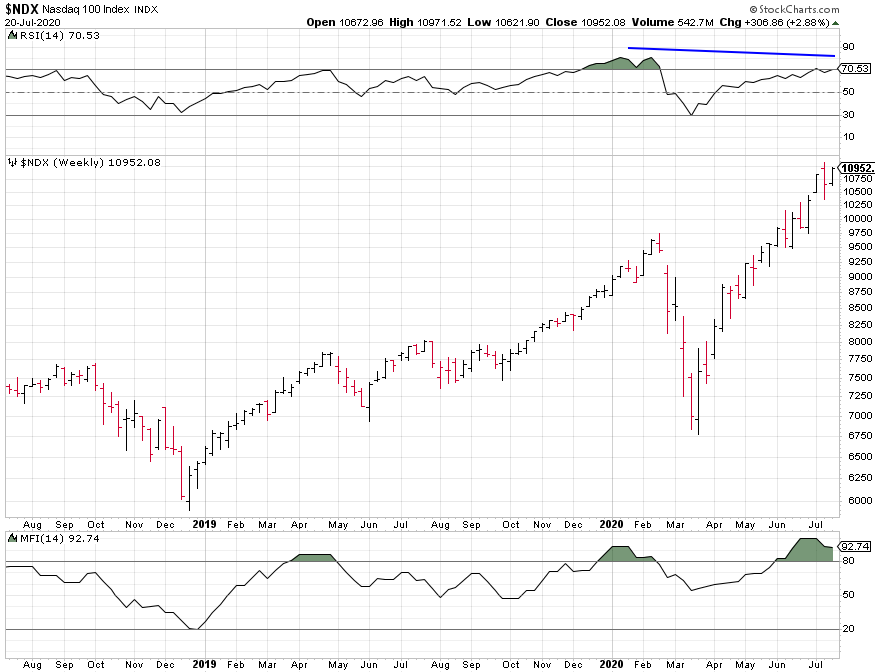
Source: StockCharts.com
Various measure of market breadth I monitor are perhaps giving us the best signals yet that this rally may be coming to an end. The percentage of stocks in the S&P 500 trading above their 50 and 200 day moving averages respectively have diverged in a bearish fashion since early June. Similar patters seen over recent years have usually preceded some form of a market pullback or weakness in the ensuing weeks.
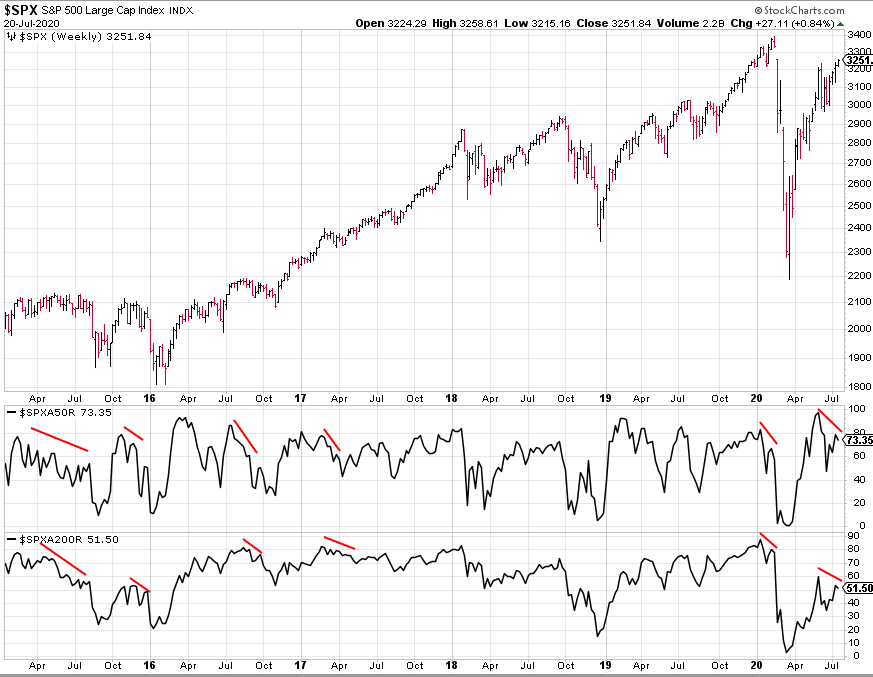
Source: StockCharts.com
Not only has the ratio of the equally weighted S&P 500 relative to the market cap weighted version not confirmed the new highs, it is showing an extreme divergence since early June. Historically, the equally weighted index has outperformed over the first half or so of the business cycle, particularly during the expansion phase for equity markets following recent recessions. This ratio has effectively fallen back to its lows seen at the bottom of the March sell off and does not indicate we are entering a new longer term bull market.

Source: StockCharts.com
The McClellan Oscillator (middle below) peaked in June and has been making lower highs ever since. This follows a relatively congested period for the oscillator. What is notable however is the McClellan Summation Index (bottom below), which is a running total of the oscillator values and can be effectively viewed as a slower version of the McClellan Oscillator, has not confirmed the negative divergence. This is an indicator I will be watching closely in the coming weeks.

Source: StockCharts.com
Whilst there are various other breadth measure I follow, they are largely telling a similar message; this market rally is being stretched thin and driven largely by the tech darlings. Whilst the Fed is doing all they can to prop up the markets and the zombie companies they have created by forcing a tailwind for equities on a scale far exceeding anything they have undertaken in the past, the economic and fundamental headwind they are facing may be simply too difficult to bear.
Historically, bear market rallies are commonplace and have preceded larger falls in the index. Both the Great Depression of the 1930s and Nikkei crash of the late 20th century provide good analogs for what we are witnessing. I suspect the Fed and the Treasury will continue to do anything and everything to keep the market afloat to some capacity until the November election. Trump likes to use the stock market as a barometer to gauge his success as President. My guess is that we see a slow grind lower of the coming months and potentially coming years. But like I’ve said before, it would not surprise me if we saw new highs in the S&P, or tested March’s lows.
I am invested very defensively at present, with my only long positions since beginning of this blog being those in the precious metals and currency markets. Regarding my other holdings I have invested in over the years, I have largely sold out of my US equity exposure and only hold a few ETF’s which represent a very small portion of my overall portfolio. The majority of my equity exposure at present is represented by the Aussie markets and emerging markets, but these are within my comfort zone and largely offset by my large cash position.