Tail Risk

It appears as though economic reality may have finally caught up with the equity markets. What’s more pronounced now more than at any time over the preceding five years is how far the valuations have diverged from the fundamentals of the five largest constituents of the S&P 500, i.e. Microsoft, Apple, Amazon, Alphabet (Google) and Facebook. These five companies now make up over 20% of the worlds foremost equity index.
This diversion between price and fundamentals is particularly evident for Amazon and Facebook.

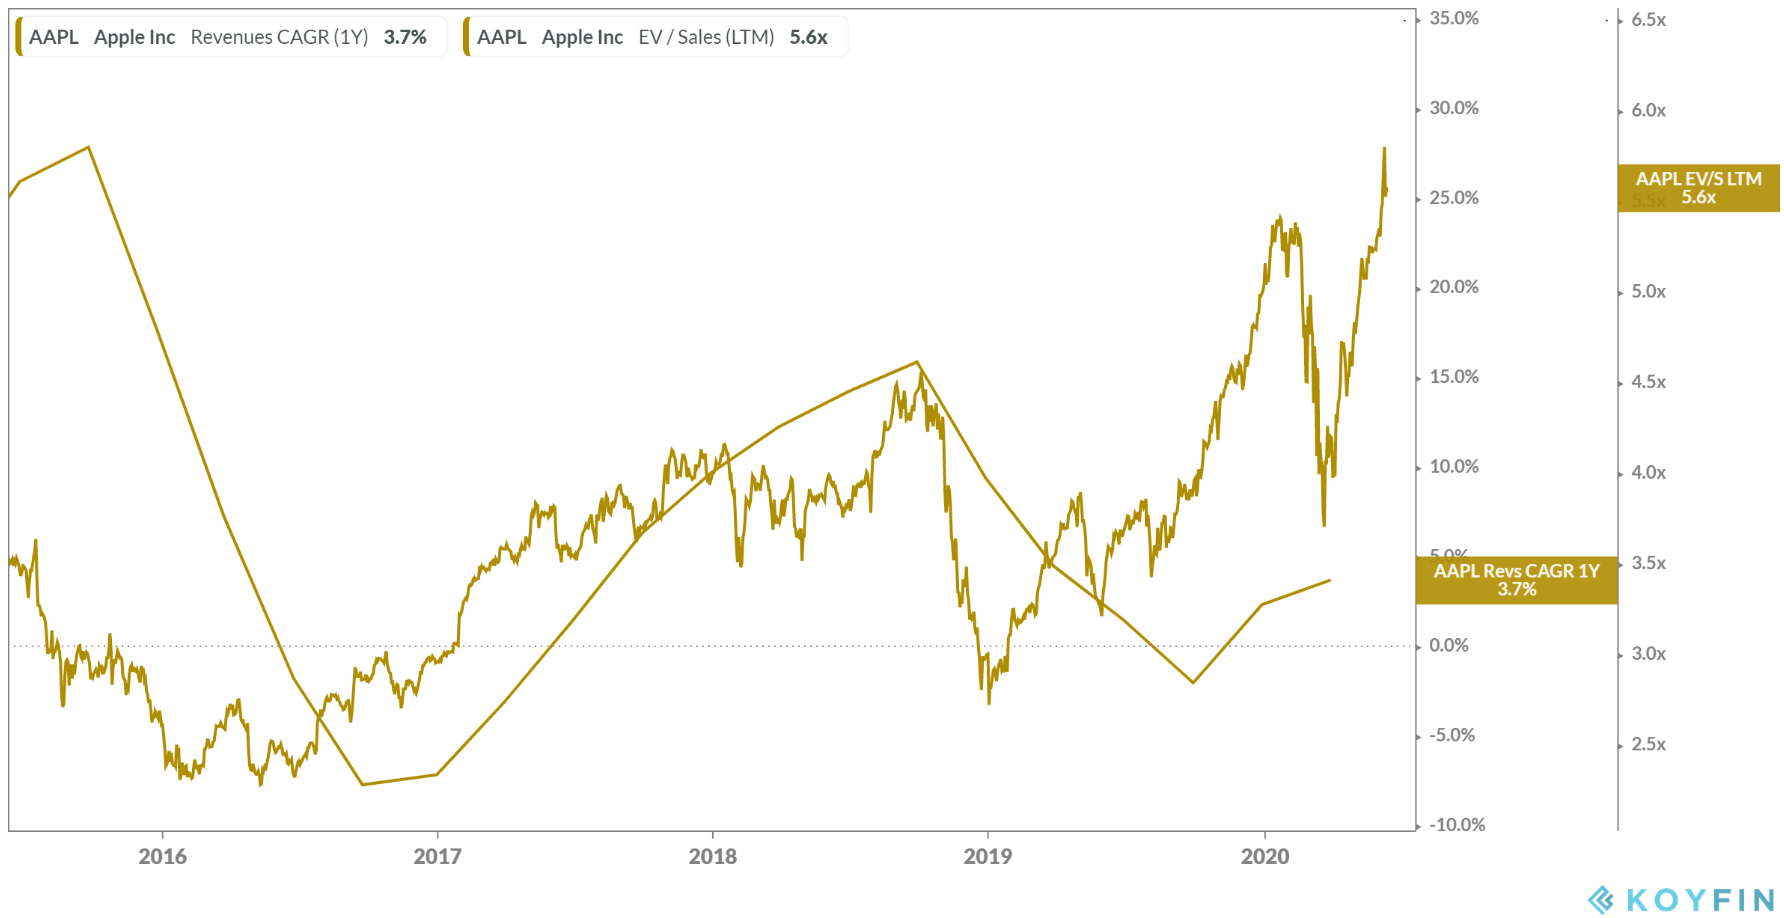
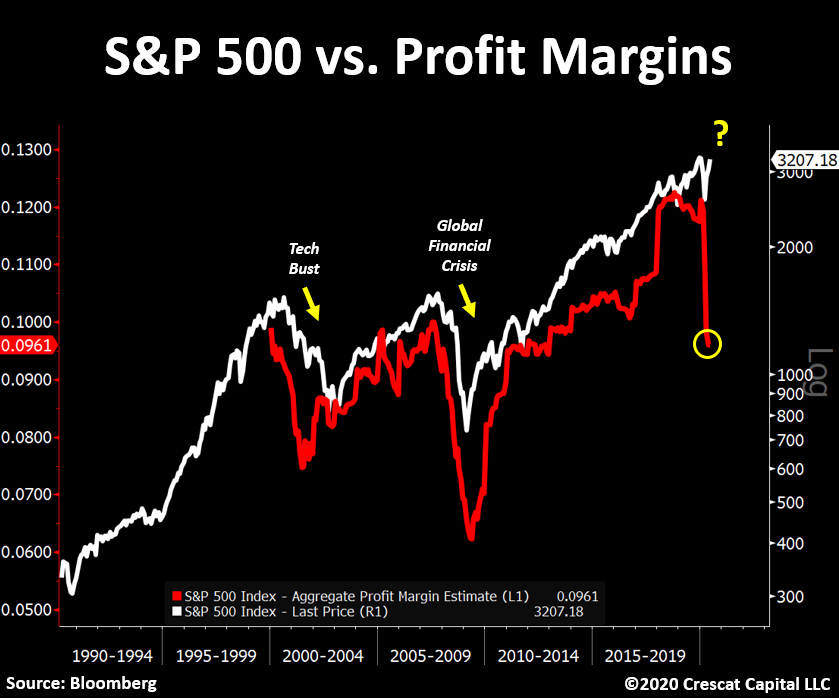
It’s not hard to see that the upside for these companies relative to their downside risk is not favourable. Valuations remain at all time highs. The relationship between fundamentals and price is one that does hold over the long-term, no matter how optimistic investors and analysts become in the short-term.
It appears this renewed equity bull market may have finally run its course. What is perhaps now the biggest driver of equity prices this decade has been the liquidity injections by the Federal Reserve in the form of quantitative easing, which has now effectively morphed into full on debt monitisation.
Taking a look at the rate of expansion of the Fed’s balance sheet (asset purchases) net of government borrowing (to fund the ever increasing fiscal deficit), we can see that the net stimulus being provided by the Fed has now turned negative.

If we look at this relationship over the past decade, net negative liquidity has not been favourable for equities.

Looking at the S&P 500 from a technical perspective, the index recently completed a Tom Demark daily 9-13-9 sell signal, whilst also breaking below its uptrend since the market lows of mid March, finding support at its 50 day moving average. This comes accompanied by a short term peak in momentum and waning money flow.

What’s evident too is the recent short-term highs have been made on lower trading volume. This trend differs from what we have seen so far during this rally where the new highs were largely accompanied by an increase in volume, indicating that demand may be starting to fade.

Looking at the Coppock Curve, which has a long history of picking the bottom of bear markets during almost every recession in the past 60 years, has at no point indicated that the bearish forces triggered by COVID-19 have been fully felt in the equity markets. In every recession since 1970, this indicator has fallen below zero before reversing upwards, giving a long-term buy signal. This did not occur during the March lows.

Given the precarious position most economies find themselves in at present, to me it appears that what can only really be described as a bear market rally driven by novice day traders who have “bought the dip”, ever increasing flows into passive index, systematic and rules based funds whose buying is price insensitive, and a market that has been propped up by the liquidity of central banks may be finally ready to roll over and once again realign itself with economic reality.
As a result, I have recently taken off almost all of my US long equity exposure. Whilst it is beyond my skill level to be shorting the market, I do believe now is as good a time as any to hedge any long exposure one may hold.