Why It’s Still Difficult To Be Bearish The US Economy
Summary & Key Takeaways:
The US economy remains resilient.
We are beginning to see signs of life in the manufacturing sector, with recent weakness is primarily a result of the most lagging economic data in the form of income and employment.
Understand where the business cycle is heading, and you will have an excellent grasp on where nearly every economic data point and asset class is heading over the medium-term.
As it stands, the majority of lead indicators remain supportive of the US business cycle on net. While it seems likely we could have some further economic weakness over the short term, it is difficult to argue for any kind of material slowdown in the economy from here.
However, unless we see further positive developments in the housing and residential investment sectors, any type of business cycle upturn is likely to be limited.
In addition, although a number of global business cycle lead indicators are supportive of the business cycle, China is not. And until we see a pick-up in Chinese lead indicators such as the China credit impulse, global growth is likely capped.
Coming into mid-year, markets had priced in a robust recovery in the US and global economies, leaving them exposed to short-term growth disappointments. This is exactly what has taken place in recent weeks.
Commodities remain the most attractive investment from a growth cycle perspective, though they may continue to struggle in the short-term.
The US economy has weakened but remains robust
My view on the US economy for some time has been that coincident economic data such as industrial production, consumption and employment are likely to bottom in late 2023 and the first half of 2024. This has largely played out, and although weakness in employment data has lasted longer than I expected, the US economy is still doing okay.
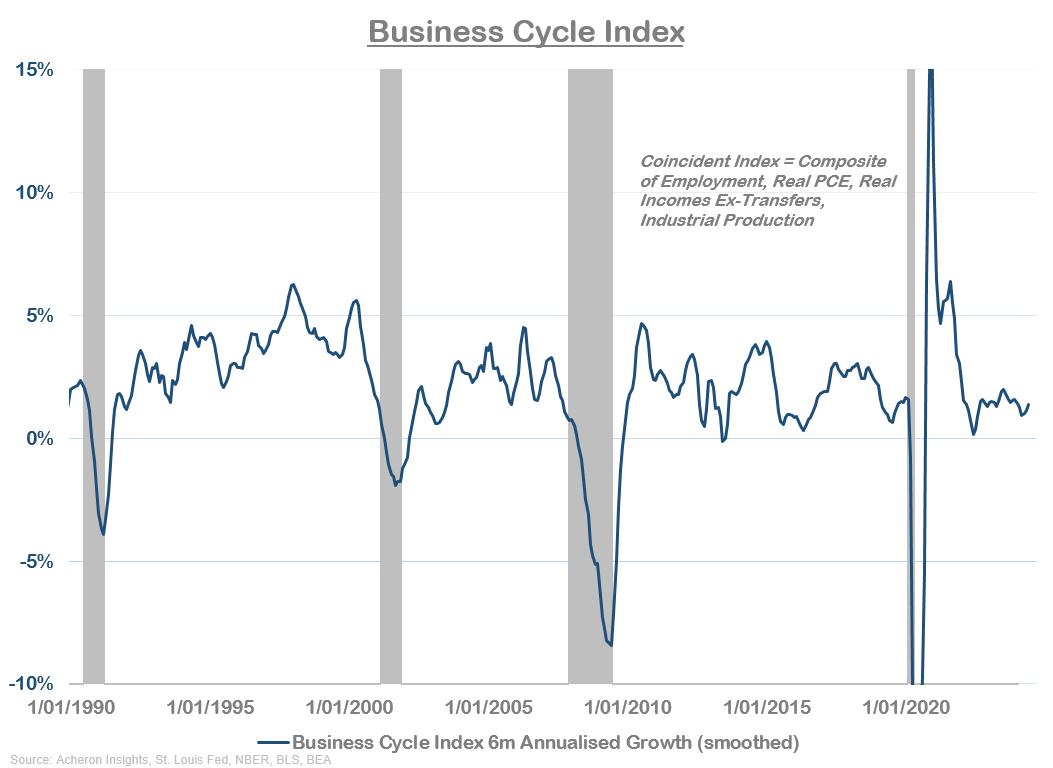
As we can see below, my Business Cycle Index has been benign over the past 18 months. This index is a brand composite of key coincident economic data in the form of employment, real personal consumption expenditures, real incomes ex-government transfers and industrial production.

While you could argue the index is at recessionary levels (which is largely a pointless argument from an investment perspective), the index itself remains in positive territory, indicating expanding growth in the US economy overall.
Below is a six-month annualised growth version of this index, which perhaps better illustrates the recent trajectory of US economic growth. We can see clearly how growth rebounded in late-2022 and 2023 following the swift decline that took place in late 2021 and the first half of 2022. It has again decelerated modestly over the past couple of quarters.
Confirming this trend is the Conference Board’s Coincident Economic Index.

If we compare these hard data with some of the soft data points that measure the business cycle in the form of the various Manufacturing PMI’s below, we can see again how growth seemingly bottomed in late-2022, rebounded slightly in 2023 and has again retraced modestly over the past few months.

Interestingly, the ISM Manufacturing PMI is painting a worse picture than the S&P or Regional Fed PMI’s. Thus, if we combine these various PMIs into a single composite, the recent move lower in growth is much less pronounced.

Digging a little further into the individual hard economic data themselves, the below dashboard displays each of the four components of my Business Cycle Index, allowing us to see where economic strength or weakness is being derived. As we can see, the majority of recent economic weakness has come in the form of declining employment growth, along with a modest decline in real incomes. On the other hand, consumption growth has been largely flat over the past 18 months, while industrial production is now looking the most constructive as it has just risen above its three-year trend.

These trends make sense as incomes and employment are generally the most lagging of economic data.
On the other hand, the coincident data that should be most responsive to business cycle expansions and contractions is from the manufacturing sector. For a business cycle expansion to play out, it must be driven by accelerating growth from this sector, which as we can see below, is not yet entirely case, though some positive progress is being made. Industrial manufacturing production and manufacturing capacity utilisation are both expanding to their highest levels in over a year (as measured on a six-month annualised growth basis), but we are not yet seeing confirmation of this from manufacturing new orders.

Soft data from the manufacturing sector is also confirming these mixed signals, with only new orders and prices paid trending higher on net.

if we turn our attention now to the less cyclical area of the US economy in the services sector (services are much more lagging and are not the driver of economic cyclicality that is the manufacturing sector), we are more or less seeing what we should expect to see at this point in the business cycle. Wage growth is decelerating, non-cyclical employment growth is decelerating while services consumption growth is relatively flat. Interestingly however, the S&P Services PMI has been trending higher over the past few months.

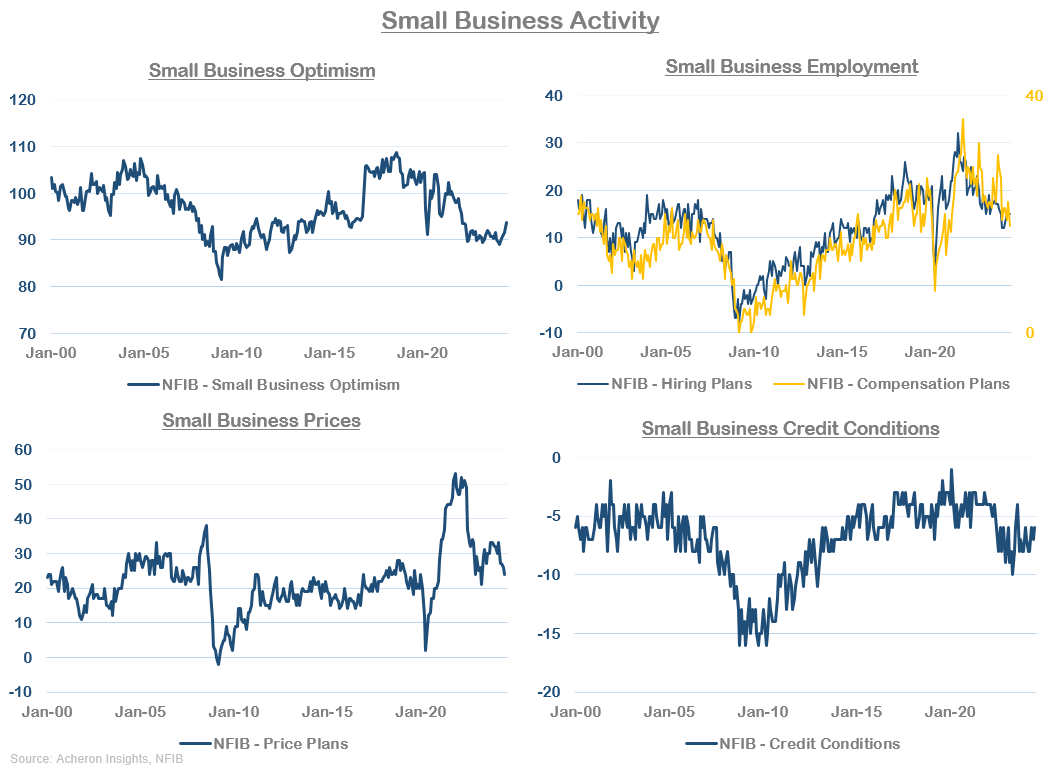
We are also seeing data from small businesses more or less align with where we are in the business cycle. Prices and employment trends are again all firmly to the downside, while we are seeing small business optimism overall look to be slowly beginning a recovery. Credit conditions for small businesses also appear to be improving.
And finally, it is also worth reviewing where consumers and households currently stand from an overall debt burden and financial wealth perspective. As we can see below, despite higher interest rates and borrowing costs, debt levels and debt serviceability for households is at or near their best levels in over two decades. The same can be said of household net worth.

Where are we in the business cycle?
Economic data in the US weakened substantially in 2022, rebounded somewhat in 2023 and has again slightly decelerated in the second quarter of 2024, with employment data currently the weakest of the core coincident data points.
As always, we must remember all data presented above are coincident to lagging by some degree, at least relative to the PMI’s which are generally the timeliest business cycle indicators. The following chart illustrates the sequencing of the business cycle, from hard economic data points as well as leading indicators and the extent to which they generally lead and lag the PMI.

Decelerating inflation, decelerating wage growth and decelerating employment growth are all trends we should expect to see when we are past the trough in the business cycle.
Additionally, the following chart is my attempt to gauge where we currently lie in the business cycle. Given the decline in economic data seen over the past 18 months, this analysis would suggest we are likely closer to the trough than the peak, while financial assets have been aggressively pricing in a growth rebound (more on this later).

The following chart is another way to help us assess where we currently stand in the business cycle. As we can see, soft economic data is suggesting economic growth has bottomed out (or is close to bottoming), while hard economic data has been much more resilient. This latter point does suggest we may see more short-term weakness for hard economic data such as employment and consumption, but that is where the lead indicators come in, which we shall review shortly.

But before we do so, let’s recall just how imperative the business cycle is. In one way or another, everything is linked to the business cycle.
Everything is linked to the business cycle in one form or another. This is true of global growth, global trade, capital expenditures, bank lending, inflation and employment. And, as we shall see later, asset prices are no exception.

Understand where the business cycle is heading, and you will have an excellent grasp on where nearly every economic data point and asset class is likely heading over the medium-term. That is where the leading economic indicators come in.
Lead indicators remain robust, but no unanimous
Turning our attention now to the lead indicators of economic growth, the story remains somewhat similar to what it has been for the last few quarters. That is, the longer-lead indicators remain relatively robust, though not outstanding. But on the whole, there is not a whole lot of evidence to suggest the US economy is about to fall off a cliff.
Will we see further short-term weakness in economic data? Quite possibly. But, according to the lead indicators, it is likely to be fleeting.
ECRI’s Weekly Leading Index is one indicator potentially pointing to further weakness in the short-term, as we can see below.

The ISM New Orders less Inventories spread is another lead indicator suggesting some short-term weakness in economic growth may be forthcoming.

But again, any short-term weakness is unlikely to be long-lasting. Here is the Conference Board’s Leading Economic Index versus my coincident Business Cycle Index, with the former leading by around three months and continuing to trend higher. Remember, it is the turning points and direction of lead indicators that are most useful, rather than the magnitude of the directional move.

The Conference Board’s is not the only lead indicator to be accelerating, the OECD’s Composite Leading Indicator for the US also continues to trend higher.

Meanwhile, bank lending standards continue to ease. This should eventually translate into an uptick in industrial production growth.

The same can be said for retail sales, given its relationship with lending standards for credit card loans. Though it should be noted, the magnitude of easing in lending standards for credit cards has been much less significant relative to business loans. If retail sales are to grow meaningfully from here, credit card standards need to ease further.

We are also starting to see the more cyclical components of GDP begin to accelerate on a growth rate basis, a dynamic which tends to lead overall GDP growth itself. Residential investment, durable goods and trucking/transportation are perhaps the three most important cyclical drivers of the economy, as we can see below.

Meanwhile, regional Federal Reserve data also continues to improve, as illustrated below via a composite of the various new orders less inventories regional Fed data points.

Thanks to the asset price boom over the past 12 months, household net worth has also grown significantly. Even though the distribution of wealth in the US is skewed to the top 10%, the wealth effect is a significant driver of GDP growth, as evidenced below.

Household net worth is also a particularly important driver of retail sales growth.

My consumer spending lead indicator is also suggesting retail sales growth should accelerate from here.

The easing of financial conditions we have seen over the past year should also be relatively supportive of economic growth over the coming six months.

The global monetary policy cycle is also now tilted toward supporting the business cycle, given global central banks on net are now cutting interest rates.

The economy is also getting some level of support from the housing market, which as I mentioned earlier, is one of the primary drivers of economic cyclicality. Building permits have accelerated modestly over the past year, though they have rolled over in recent months.

The same can be said of residential investment. For the US economy to see a significant upswing over the next year or so, we must see residential investment and housing related activity pick-up. If we don’t, it will be difficult for the economy to accelerate meaningfully from here.

For now, these development are still on the margins supportive of the business cycle.
Where we should also see some positive growth moving forward is via the inventory cycle. We can see the relationship between inventories and the business cycle below.

Inventory buildouts and restocking are a key driver of economic cyclicality, given they drive much of the demand for manufacturing, commodities and trade. We should expect to see some kind of inflection higher in manufacturing inventories over the next six to nine months, though at this stage its magnitude is questionable. At the very least, the inventory cycle looks to be bottoming.

The easing of inflation and price pressures we have seen over the past 18 months should also be supportive of growth moving forward. Below is the ISM Manufacturing Prices Paid Index (inverted) versus the PMI, with the former being a reliable proxy for manufacturing input costs.

The same can be said of food and energy prices, which generally leads the business cycle by around 18-24 months.

Borrowing costs also continue to become less restrictive for growth.

My various PMI Nowcast’s are suggesting we should see robust growth moving forward. While I do not expect a PMI rebound as aggressive as what is being forecast below, it’s the direction that counts.

My Macro Conditions Lead Index also remains supportive over the coming six to nine months. This index is a composite of commodity prices, borrowing costs and the dollar, all of which are important drivers of the business cycle, as we have seen.

As it stands, the majority of business cycle lead indicators remain supportive of the US business cycle on net. While it seems likely we could have some further weakness in growth over the short term (particularly from the lagging hard data points in the form of employment and incomes), it is difficult to argue for any kind of material slowdown in the economy.
However, unless we see further positive developments from the housing and residential investment sectors, any business cycle upturn is likely to be limited.
A quick word on global growth
Given how closely tied the business cycle in the US is to the global business cycle, it is also worth reviewing a few important lead indicators for the latter.
As we can see in the below dashboard, most of my global LEI’s remain relatively supportive on net for the global business cycle. We should see the global manufacturing PMI move modestly higher in the coming months, as should European GDP and Germany’s industrial production.

One key indicator worth keeping an eye on is Sweden’s Manufacturing New Orders PMI, which has ticked down over the past couple of months. Given Sweden’s role as a key manufacturer in Europe, they are an important driver of the European and global business cycles and one of the leading economies. So, should the Sweden PMI data continue to roll over, European economic activity overall is unlikely to move materially higher in the short-term. Overall, these is little evidence above to suggest significant further weakness is imminent.
But where there is cause for concern is China. Without China positively contributing to the global business cycle, it will be very difficult to see any kind of notable expansion in global growth unfold.
My preferred proxy for Chinese economic activity and its implications is the China Credit Impulse. We can see below how this leads the global business cycle by around six months. It currently paints gloomy picture over the short-term.

Fortunately, there appears to finally be some constructive movements on the China stimulus front. As we can see below, Chinese interest rates (in particular the Shanghai Interbank Offer Rate) tend to lead the China credit impulse (in addition to other Chinese liquidity measures such as M1), by around nine to 12 months in an inverse manner. Chinese yields have been falling of late, so, this should at some point translate into increased credit creation within China later in 2024, which itself should eventually translate into increased economic activity.


Market pricing and investment implications
With the business cycle and growth taking a hit over the past few months, it has unsurprisingly not been an overly favourable time for risk assets, particularly those most exposed to economic activity, such as commodities. My stock market PMI quadrant shifted into a neutral/underweight position at the end of April. I suspect we may remain there for another month or two, but later this year we ought to see a shift back into the overweight risk assets section of the quadrant, given what the lead indicators suggest.

The simple fact is by the second quarter of this year, the stock market had priced in all the positive outlook for equities. This was particularly so for the S&P 500 and Nasdaq, which primarily consists of the companies that are generally the most forward looking.
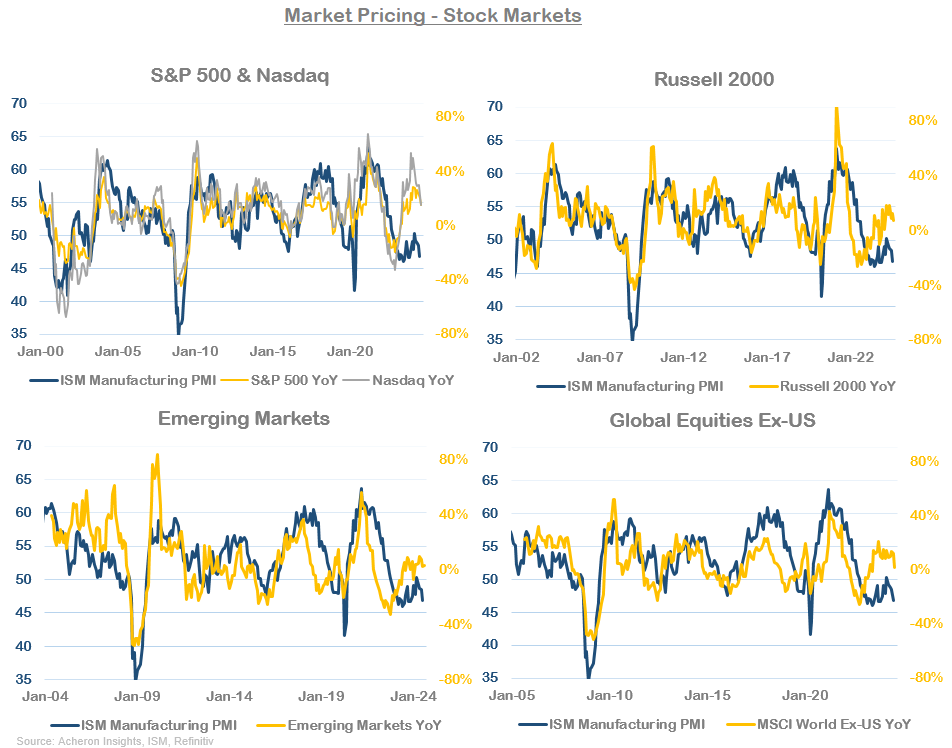
This aggressive market pricing was even more extreme from the tech, growth and “long duration” areas of the stock market.

This left the S&P 500 and Nasdaq very susceptible to short-term growth disappointments, which his exactly what we have seen over the past couple of months. Almost all my fundamental/macro indicators for stocks began sending warning signals around June/July.

Given the recent pull-back in the market, some of the aggressive pricing in of a business cycle upturn has been unwound (though markets have so far done a good job erasing August’s losses), meaning the risk/reward for the stock indices over the medium-term has improved, especially if we do see growth continue to hold up.
For the more cyclical and economically sensitive areas of the market whose earnings are more exposed to actual underlying economic activity, the aggressive market pricing in 2024 was somewhat less extreme (particularly for the materials sector). Moving forward, these areas of market should continue to hold up relatively well given the robust outlook for the economy.

Commodities on the other hand have unsurprisingly been weak over the past year. I don’t see commodities moving notably lower from here given what I have laid out in this article, but, until we do see Chinese economic activity pick-up, the commodity story may be on hold until a little later in 2024/early 2025. Having said that, if one were bullish the global business cycle over the next 12 months, commodities do look attractive at present.

. . .
Thanks for reading!
If you would like to support my work and continue to allow me to do what I love, feel free to buy me a coffee, which you can do here. It would be truly appreciated.
Regardless, feel free to share this with friends and around your network. Any and all exposure goes a long way and is very much appreciated. Thanks again.