Is It Time For Gold Bulls To Buy The Dip?
Back in January, I was calling for a short-term top in precious metals markets. This was based on the premise that a number of fundamental, technical and positioning indicators were sending signals of caution, and fortuitously, this call has proved both prescient and profitable. Indeed, as I continued to take profits throughout January as precious metals prices soared, the month of February has since seen gold correct 8%, silver 15% and gold miners roughly 20%.
To be clear, gold had seen a terrific run from November through January and such a pullback was hardly an outlandish call, but rather a healthy and constructive outcome in an asset class to which I am bullish over the long-run. Now, the question is: has this correction has run its course, or does further downside beckon. Let’s dig in.
Real yields are still a headwind… for now
As has been the case for a couple of months now, real yields have been moving higher (inverted below) thus pressuring the gold price given their negative correlation. This was true through much of the year-end rally and continues to be the case today.
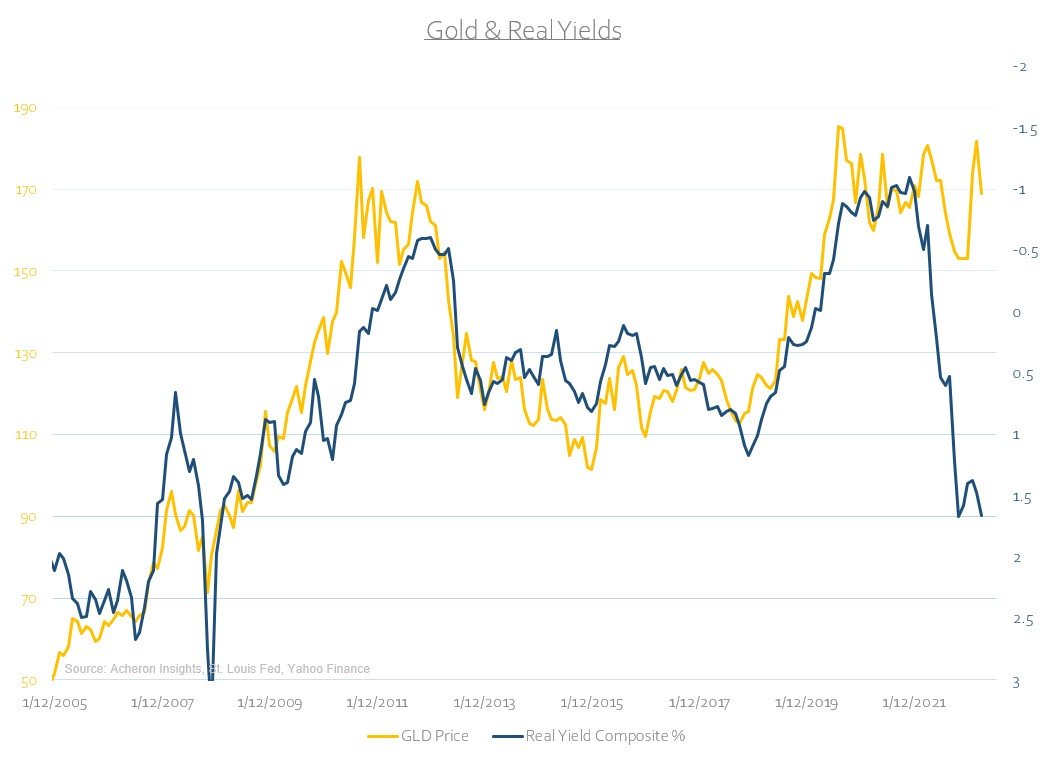
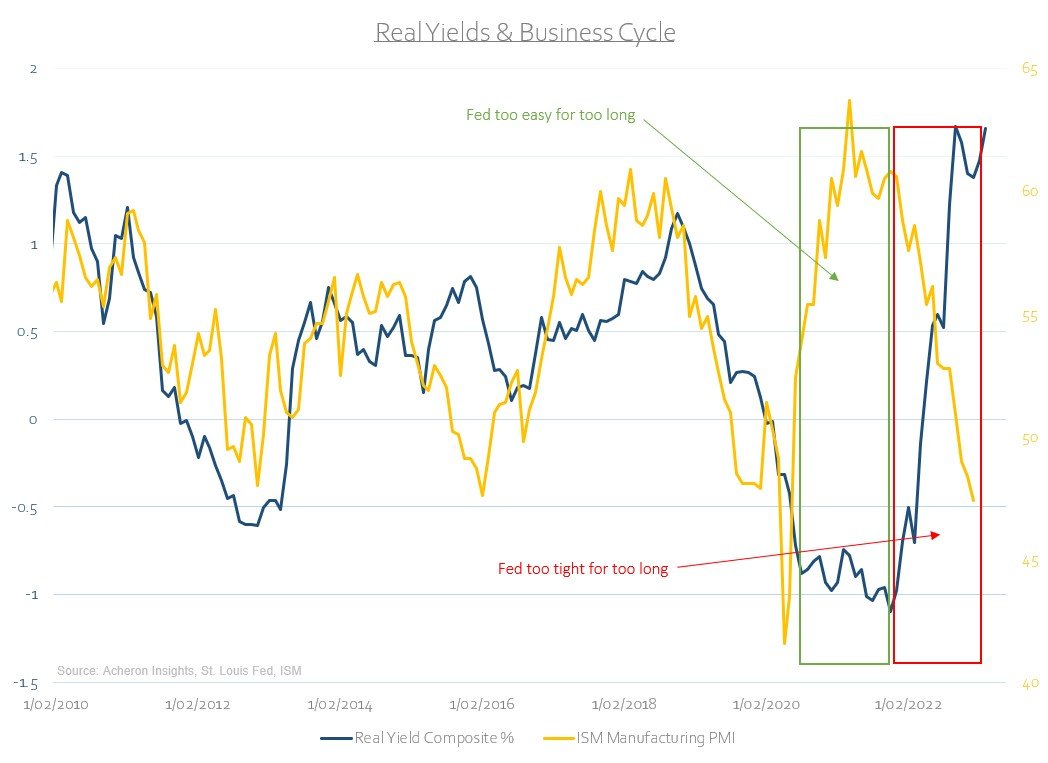
Although precious metals have held up well in the face of higher real yields through much of 2022, this dynamic is yet to turn in favour of gold. Until the Federal Reserve reverses course and retreats from its tightening agenda, real yields are likely to remain a headwind. For how long this is so remains to be seen, but, one indicator I use to predict the path of real yields is the business cycle (though the relationship between the two has been skewed of late due to on overly influential Fed, as highlighted in the below chart). The business cycle suggests we will see real yields move lower at some point this year, but this is unlikely to occur until recession and growth fears outweigh inflation fears, at which point nominal yields will likely fall at a faster pace than inflation expectations, pushing real yields lower and as a result, gold prices higher. I suspect we are not quite there yet.
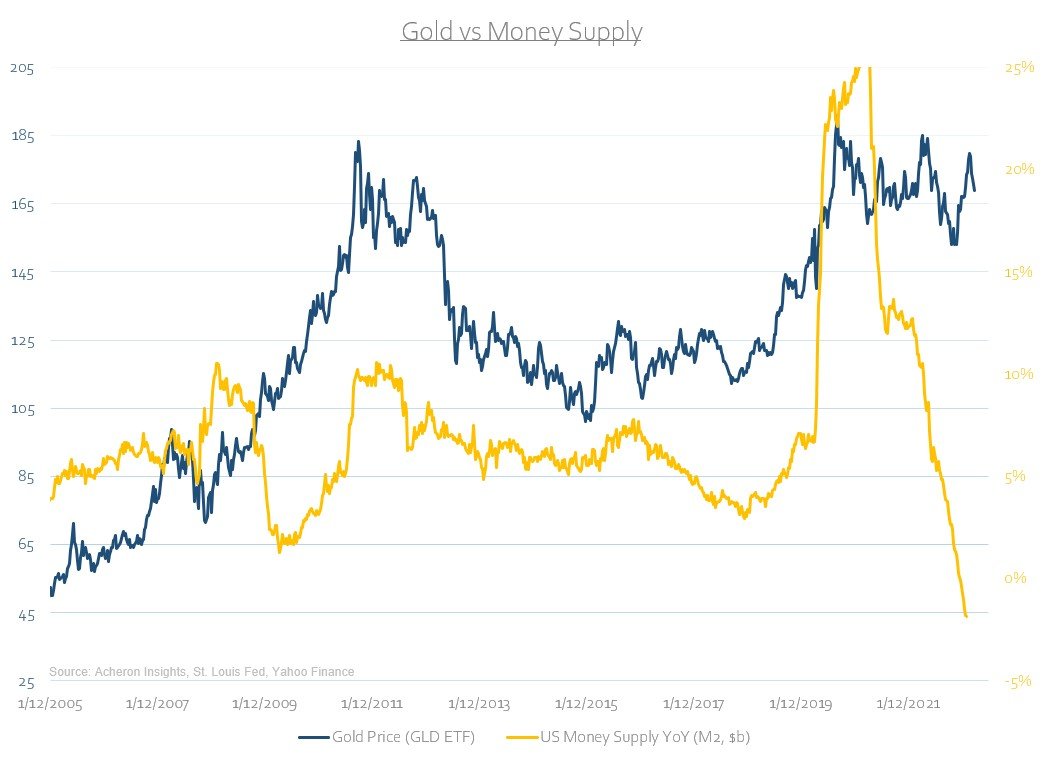
Gold and precious metals generally perform best during periods of financial repression and easy monetary policy conditions that see the debasement of currency. Not only does such an environment entail negative real yields, but fluctuations in the supply of money tend also to be a significant fundamental driver. We can see below how the long-term tops and bottoms in the gold price has often coincided with inflection points in the US money supply (M2). For now, M2 growth is largely being constrained via the Fed’s balance sheet tapering and thus remains a headwind for precious metals. Again, until recession fears outweigh inflation fears and the labour market dynamics can afford an easier Fed, I suspect currency debasement to be tame and remain a headwind for precious metals, at least in the short-term.
The dollar headwind could soon turn tailwind
Such dynamics around real yields and M2 does not mean gold and precious metals cannot still move higher however. Indeed, it may not all be bad news for the fundamental drivers of precious metals. Enter the dollar. While they don’t always trade in lockstep, the inverse correlation between the two has been particularly heightened on late, so much so that the pullback in precious metals has effectively just been a product of the recently rally in the greenback.

While my long-term outlook for the dollar is a bearish one, I have been expecting at least some sort of relief rally following it’s material pull-back off the September highs. This has now occurred, and whether it continues for the ensuing months I am unsure. My outlook for the business cycle suggest it may, but, at from a technical perspective, a number of signs suggest this is merely a relief rally amid the beginning of a long-term downtrend. Either way, I suspect the kind of move higher in the dollar we saw during 2022 is unlikely to repeat in 2023.
Indeed, on the daily chart we are set to trigger a DeMark 9 sequential sell signal this week, while the recent move higher also looks to be running into overhead resistance at the $105 level on the DXY. Likewise, the weekly chart has also rallied back to the underside of the 50-week moving average, a point at which a rejection seems the likely outcome.


Should the dollar break these levels to the upside then all bets are off as this would bode poorly for precious metals and risk assets alike, but it cannot be overstated how much technical damage has been done as part of the recent sell-off. A continued rebound in the Yen would only exacerbate any dollar weakness.
No clear signal from a positioning perspective
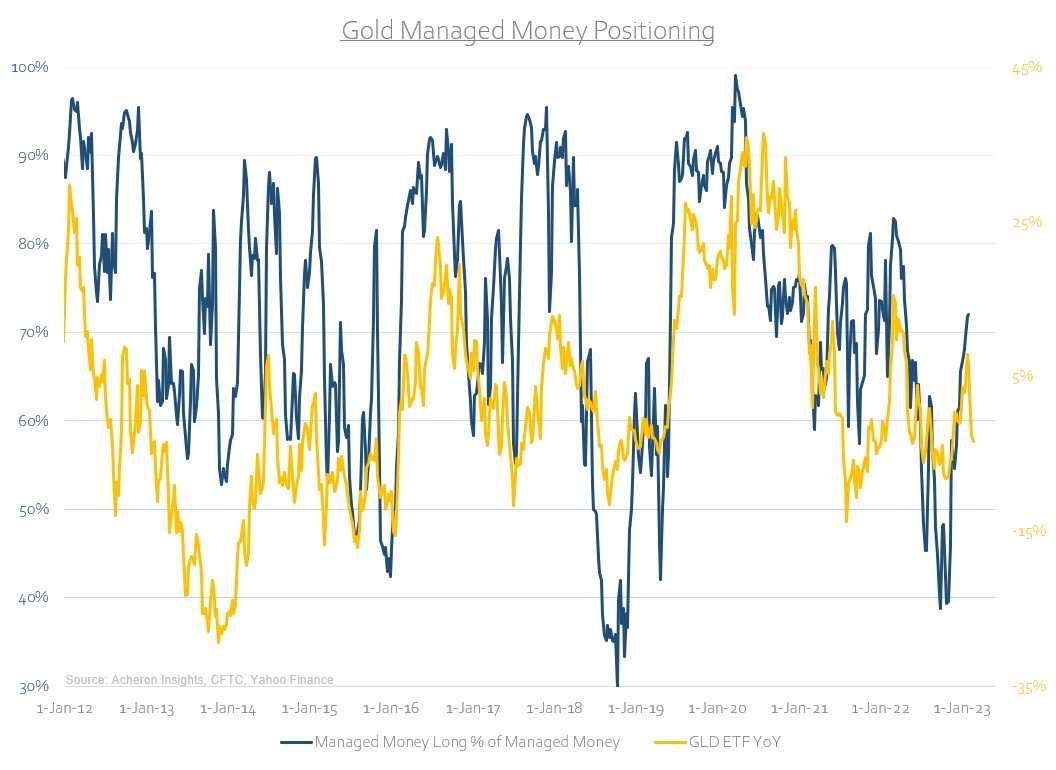
As it stands there is little of any meaningful signal from the realm of sentiment and positioning, with things looking fairly neutral.
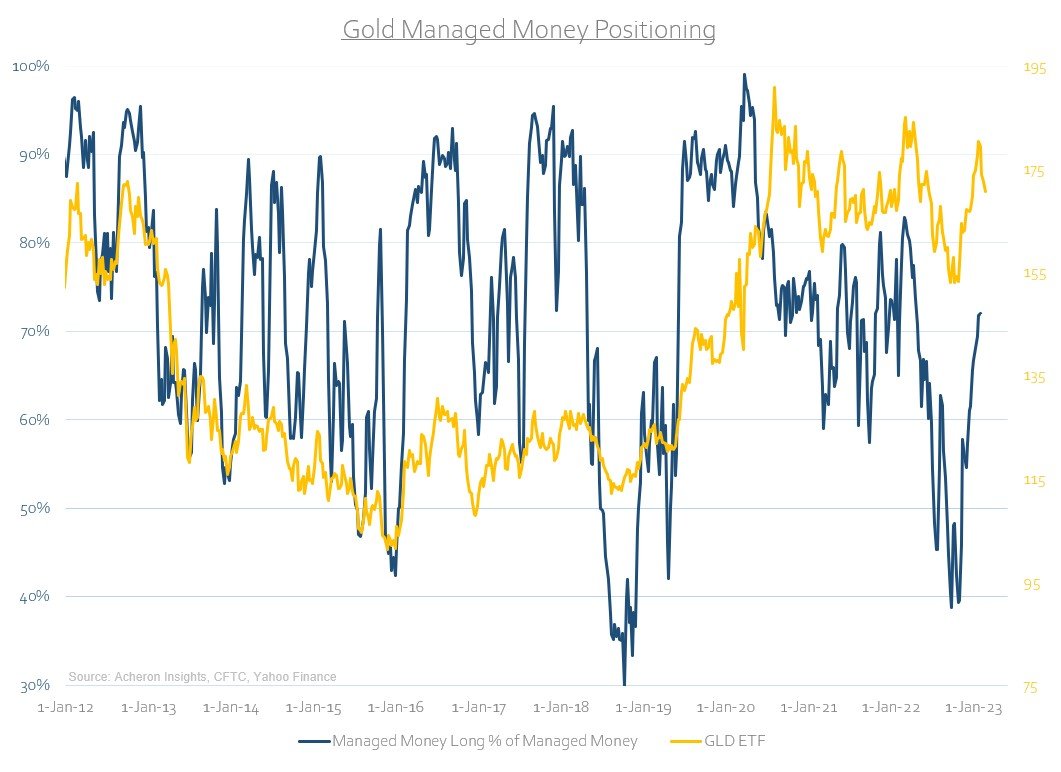
My preference is to assess positioning through the lens of managed money (i.e. hedge funds and CTA’s) within the futures market, as these players within the market tend to be the primary driver of the trend. While the CFTC Commitment of Traders data has yet to be released for February, we saw hedge funds and the like add material long exposure during the rally that closed out 2022, and now find themselves in neutral territory. Though there is plenty of scope for hedge funds to still drive gold and silver higher or lower from here, for a contrarian like myself, I would like to see a washout of these long positions before I once again can become materially overweight precious metals.
The physical market is still tight
What has been a bullish development for some months now is the remarkable tightness in the physical market for both gold and silver, likely driven by the significant level of central bank buying we have seen in recent quarters.
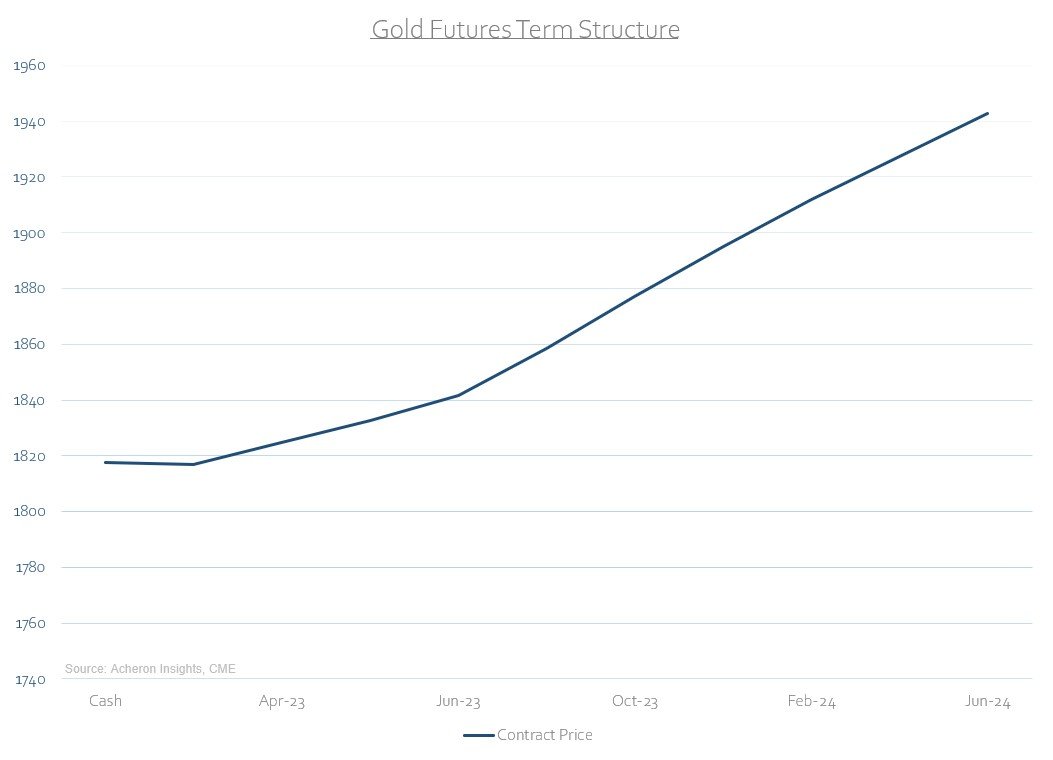
For most commodities, a useful tool to assess the dynamics within the physical market is by examining the shape (i.e. term structure) of the futures curve. Put simply, a backwardated term structure is when short-dated contracts trade at a premium to longer-dated contracts and may be suggesting buyers are willing to pay a premium for immediate delivery of the physical commodity, despite the additional storage and transportation costs associated said delivery. This is generally consistent with a dynamic whereby demand exceeds supply, and of course ought to be considered bullish.
As we can see below, there remains a small level of backwardation at the front end of the curve. This is not a common occurrence within the gold or silver markets. So long as this remains, one would suspect there is likely a higher floor under the gold and silver markets.
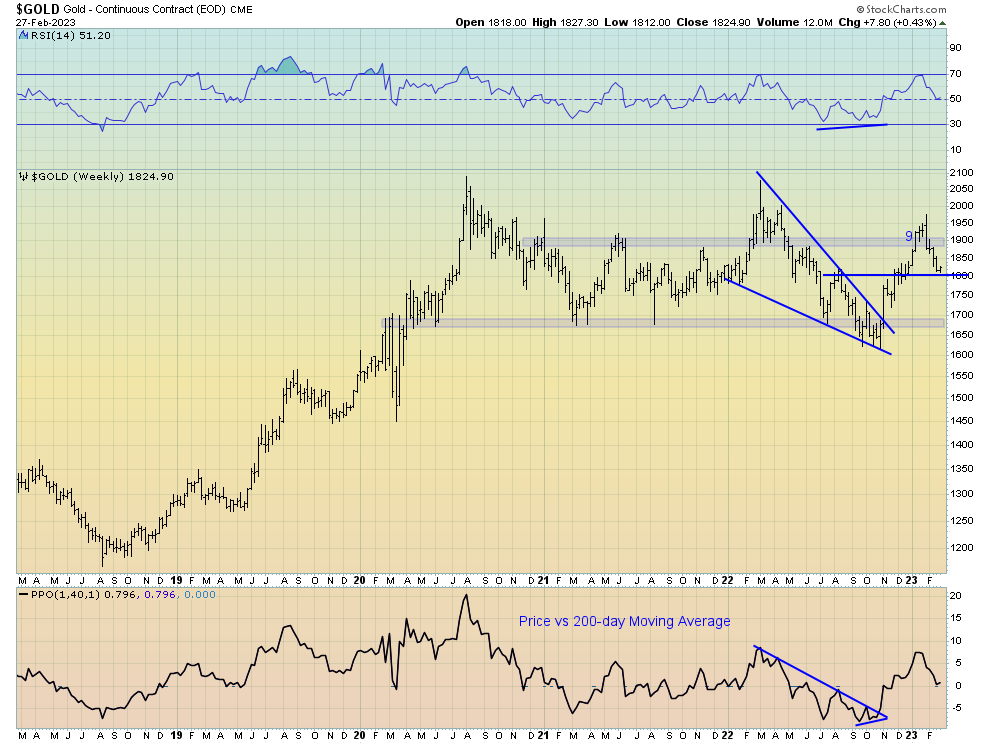
The technicals
Turning out attention to the technicals of the precious metals markets through the lens of the weekly charts of gold and silver, it’s clear this recent pullback is beginning to reach some important technical support levels. As we can see below, $1,800 for gold and $21 for silver mark the most obvious immediate areas of support and perhaps represent areas worth adding exposure. Should this correction extend further, I would expect gold and silver to trade down to $1,700 and $19 in short order. Again, such levels would be worth putting capital to work, depending on the fundamental developments at such a time.

One material technical headwind facing precious metals for now is seasonality, with March through mid-year being a poor period for the gold price. Although seasonality is a poor indicator when used in isolation, it is worth consideration as part of a broad array of indicators. If anything is to be gleaned from this indicator at present it is that we may see sideways price action at the very least for the next few months, a notion largely confirmed by the outlook for real yields.

In summary, there are a number of conflicting fundamental, positioning and technical signals within the precious metals market at present. The current correction has been constructive thus far, and we are clearly reaching levels where one may wish to again add exposure to the sector, be it physical gold, silver or via the miners. However, we should be cognisant of the idea this correction could still play out further over the coming months, particularly should the Fed maintain its uber hawkish stance and real yields prove sticky. Further patience is likely required for now.
. . .
Thanks for reading!
If you would like to support my work and continue to allow me to do what I love, feel free to buy me a coffee, which you can do here. It would be truly appreciated.
Regardless, feel free to share this with friends and around your network. Any and all exposure goes a long way and is very much appreciated. Thanks again.