Growth Cycle Outlook: Sell The Rally
Summary & key takeaways
According to the leading indicators of economic growth, the business cycle looks set to enter a period of material deceleration in the months ahead. This growth downturn is a continuation of the slowdown that began in the latter half of 2021.
Combined with this downturn in growth, the liquidity and earnings cycle’s remain significant headwinds for pro-cyclical equities and risk assets for the time being.
Investors will do well to continue to maintain an underweight exposure to risk assets.
Sell The Rally
Before we assess the leading indicators of the growth cycle, let us first assess where the economy resides at present. In order to determine where we lie currently in the business cycle, one of the most valuable and most popular coincident indicators of economic growth is the Institute of Supply Management’s Manufacturing Purchasing Managers Index (PMI). The manufacturing PMI provides us with an up-to-date view of where we are now in the growth cycle and where we have been. Whilst the forward-looking indicators of growth provide the most value in terms of asset allocation and investment making decisions, it is the coincident measures of growth that define the trend.
As we can see below, this growth cycle peaked last year near the highest levels in decades and have been slowly decelerating since.
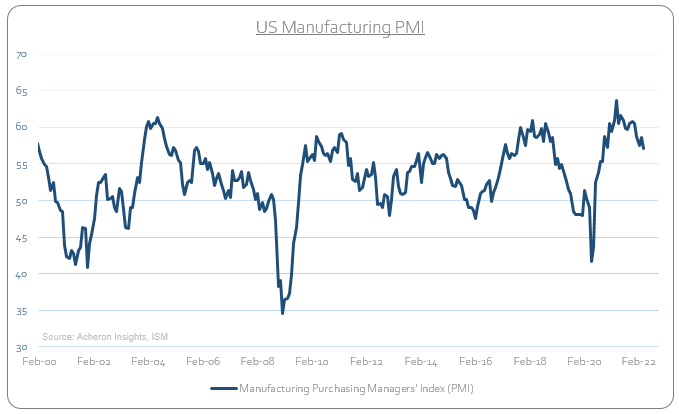
On an absolute basis a PMI reading of above 55 is indicative of a robust economy. However, it is the direction of growth that matters most for asset prices and financial markets. Should the PMI continue to move toward 50, most equity markets and risk assets should continue to struggle. This is where the leading indicators of growth provide much value.
Indeed, if we assess the long leading indicators of the business cycle (those that provide an insight as to what can be expected over the next six to 12 month), the situation continues to be far from rosy (an outlook I have been opining for some months now). Central to this thesis is the significant tightening of financial conditions that has occurred in recent months, headlined by inflation. This includes both policy and non-policy tightening of financial conditions to such a degree that prior to the Fed’s initial rate hike or balance sheet tapering what we have witnessed is perhaps the most significant level of tightening of financial conditions in decades. Prices have gone up dramatically for both corporations (PPI) and consumers (CPI) and have thus completed destroyed demand. We are already seeing signs of this flowing through to corporate profits.
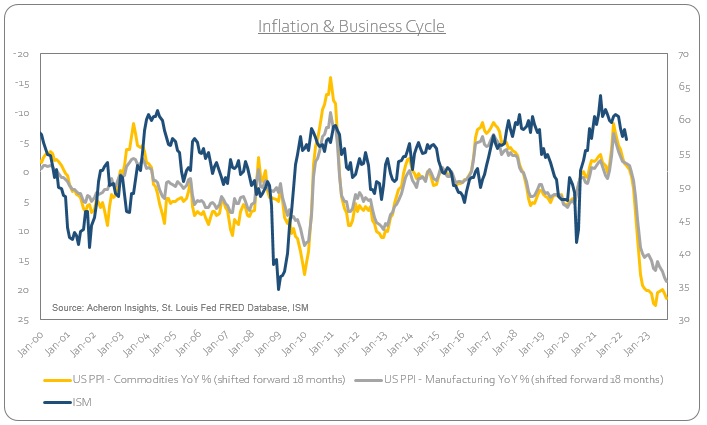
The biggest increase in prices for both households and corporations in decades was always going to destroy growth.
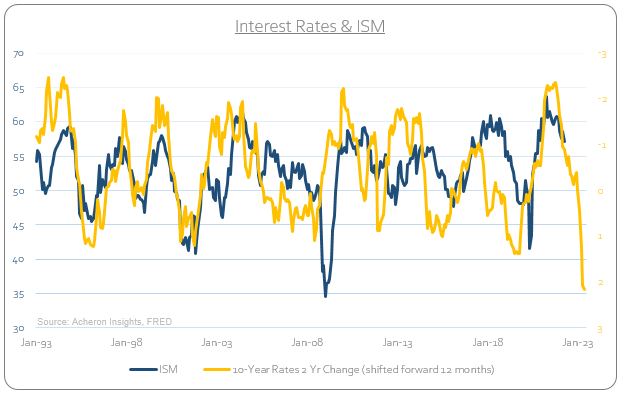
Particularly when borrowing costs adjust to reflect these higher prices.
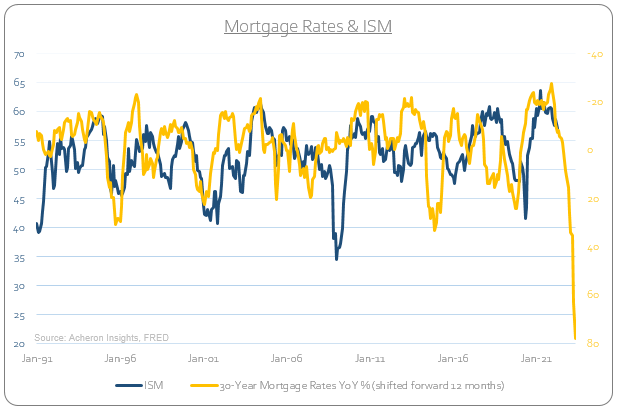
As well as mortgage rates.
If we combine the conditions of increasing borrowing costs with the recent moves higher in the dollar and energy prices to form a ‘growth tax’ composite, we are able to gain a solid understanding of what lies ahead for the growth cycle over the next 9-12 months. Clearly, the outlook for growth is challenged.
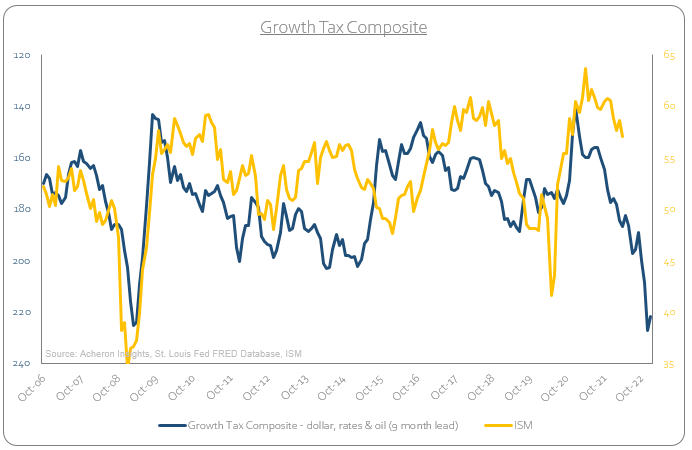
When you increase borrowing costs for households and corporations, input and energy prices and throw in a strong dollar, this becomes too much for the economy to bear.
Another excellent long leading indicator of the economy in the housing market, this too continues to point to slower growth over the next 12 months. Housing is one of the most important areas of the economy and a strong cyclical driver of the growth cycle. I wrote about the current situation within the housing market in depth recently here, and put simply, such an unprecedented move higher in rate-of-change terms in mortgage costs was always going to cyclically challenge house prices.
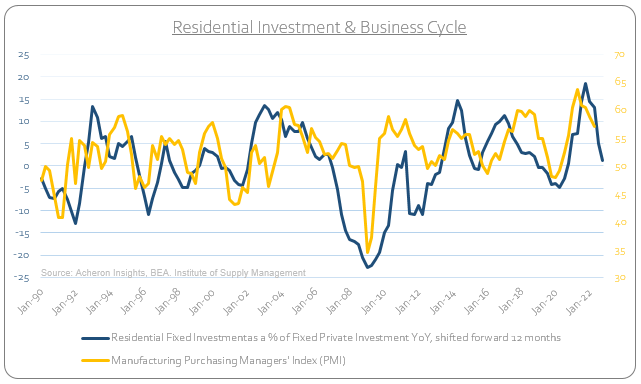
As we can see, many the longer leading indicators for the economy continue to tell us we are yet to find a bottom in this cyclical downturn. As such, a sub-50 PMI could well be on the cards at some stage this year.
From a liquidity perspective, the outlook is perhaps worse than the growth outlook. Whilst liquidity and growth are very much intertwined, liquidity, or perhaps better termed as excess-liquidity, is a more important consideration when assessing the outlook for financial markets and asset prices.
There are a number of ways to examine excess liquidity, with my preferred measure being the rate-of-change in real broad money growth (i.e. real M2) less economic growth (i.e. industrial production). This measure provides us with a solid 9-12 month forward looking outlook on what we can expect from both asset markets and the economy (via the wealth effect).
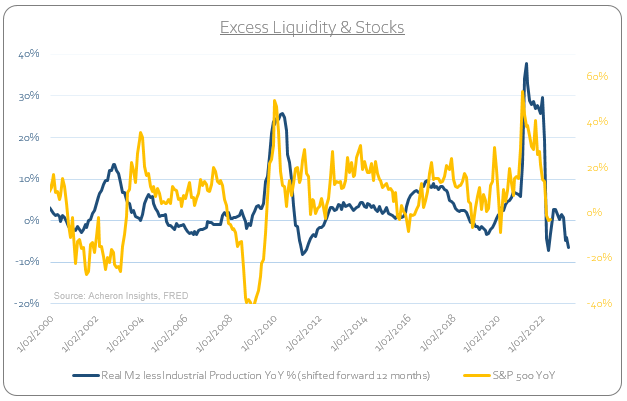
Much like what the long leading indicators of the growth cycle are signaling, excess liquidity is clearly suggesting that a cautious stance towards risk assets is warranted for the foreseeable future.
The longer-leading indicators of the economic growth and liquidity cycles are suggesting we are likely to see a material deceleration in growth for the remainder of 2022. However, it is important to remember than such indicators have little bearing for active risk management in the short-term, but instead give us a solid idea of what might occur going forward.
This is where the shorter-leads of the growth cycle provide are of value, as they allow us to more accurately determine with greater confidence the immediate trend in growth and whether this aligns with the trajectory of the longer leads.
Indeed, if we look at the shorter and timelier leading indicators of the growth cycle, we can gauge more accurately where the economy is headed over the near term, allowing us to more effectively managed risk within our portfolios.
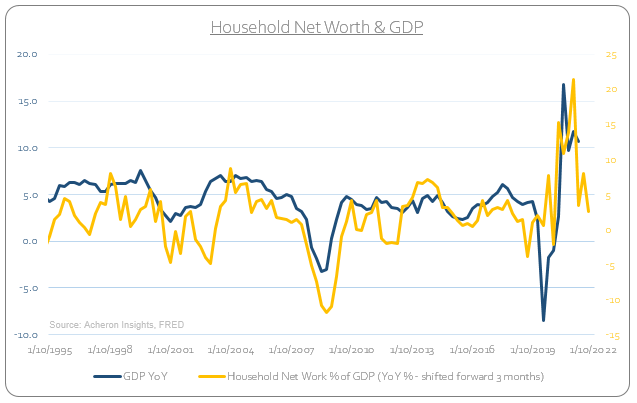
One of the best leads on the growth cycle over a three-to-six month time frame is the rate-of-change in household net worth. Given the ever-increasing financialisation of the economy, this allows us insight into how the wealth effect will boost or curtail growth.
Currently, the wealth effect is a headwind to growth and suggesting the PMI could fall to the low 50s sooner rather than later.
Digging further into the shorter leads within the manufacturing sector, several of the sub-components of the US ISM manufacturing survey can help to inform the direction of the manufacturing sector in the near term. Whilst the manufacturing sector no longer makes up as much of the overall economy as it once did, it is still a large cyclical driver of the growth cycle given manufacturing’s link to the consumption of durable goods, thus providing a real time insight into the supply and demand dynamics of the economy.
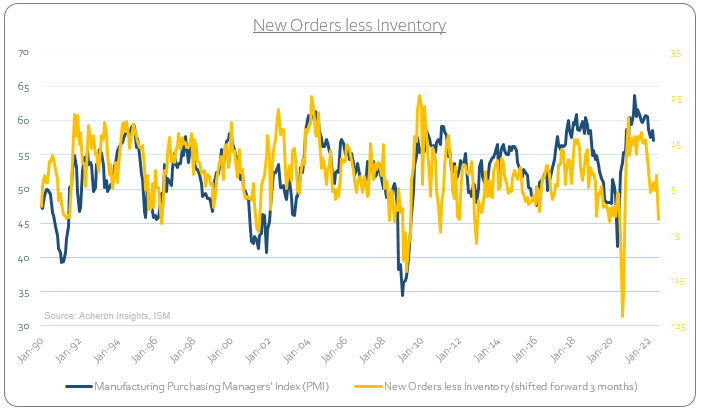
Firstly, if we look at demand through the lens of the New Orders subcomponent of the ISM manufacturing survey, we can see how much this contraction in demand is becoming a headwind for growth. New Orders are highly demand sensitive and have rolled over significantly.

Inversely, if we look at the Inventories subcomponent of the ISM manufacturing survey, the opposite is occurring. We saw a huge build-up in inventories throughout the latter stages of 2021, a dynamic that is now a headwind for growth.
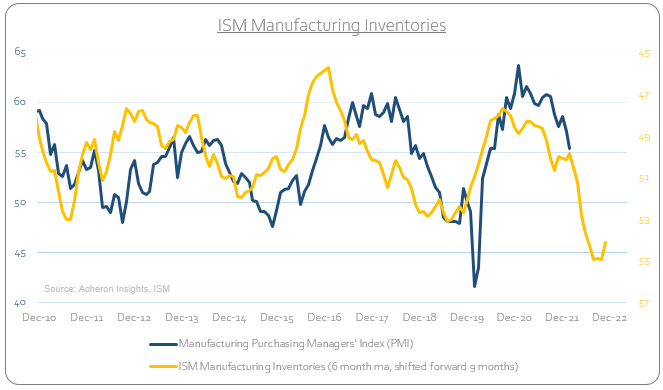
Taken together, the spread between ISM New Order and Inventories is one of the more reliable short-leads for the growth cycle. Supply has now caught up with demand, which in turn means less manufacturing and production, less need for workers and thus less wages.
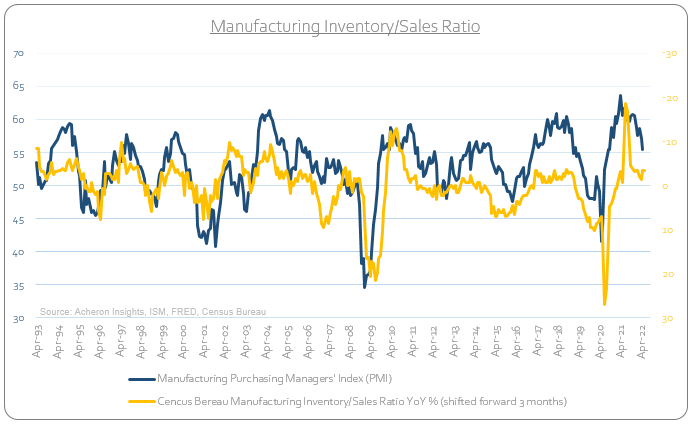
This message is being confirmed via the Census Bureau’s own manufacturing inventory/sales data.
Indeed, by looking at the mentions of weak demand by corporations, we can clearly see waning consumer demand is becoming central to this slowdown.
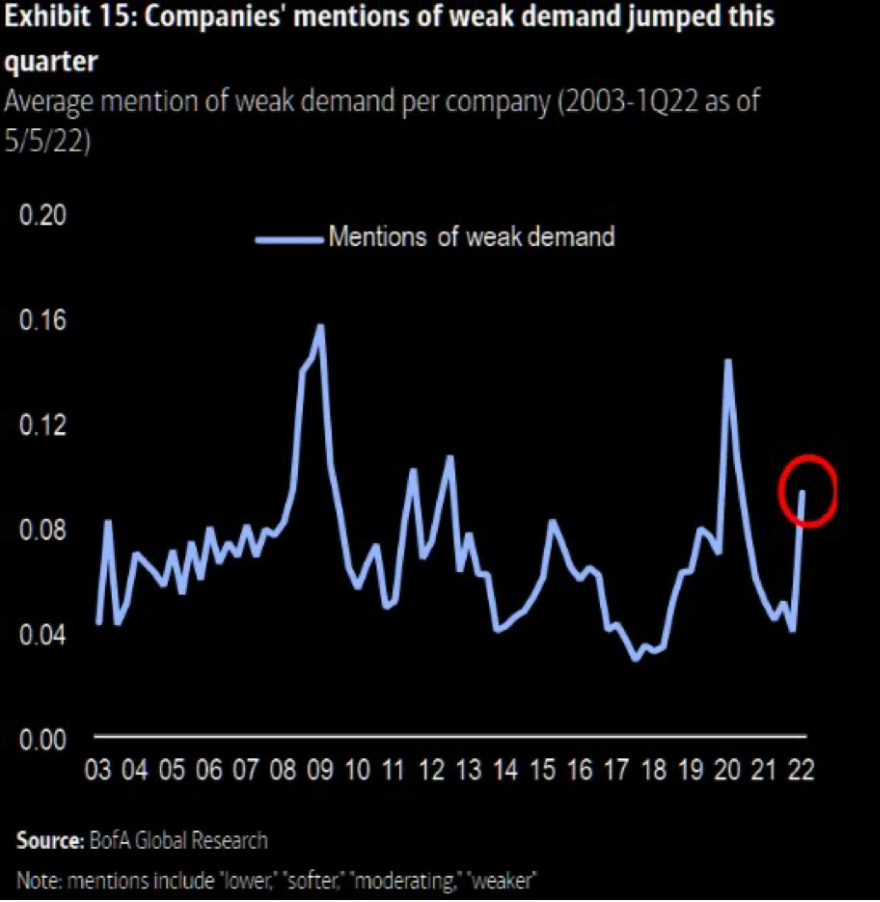
Source: Bofa Global Research
This level of demand destruction should hardly be surprising given the aforementioned increases in inflation and borrowing costs over the past 12 months. Indeed, when wages have not increased at a fast enough pace to compensate consumers for these increases in costs, real incomes fall. Not only is real income growth negative, but to a significant degree.
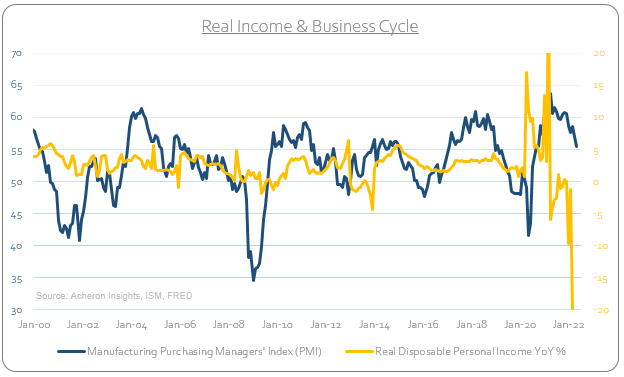
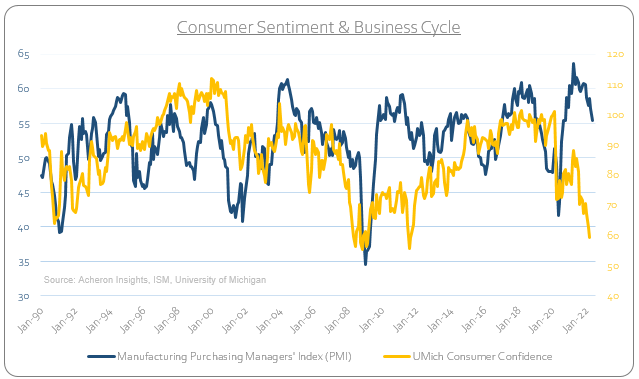
When real income growth is negative, consumers have no choice but to spend less and/or turn to credit to support their cost of living. The problem is that credit is a finite resource at the best of times, let alone when the cost of borrowing is rising. As a result, consumer sentiment is getting crushed.
And with it economy activity is stalling. We can see this by looking at the rate of change in Rail Freight Carloading’s.
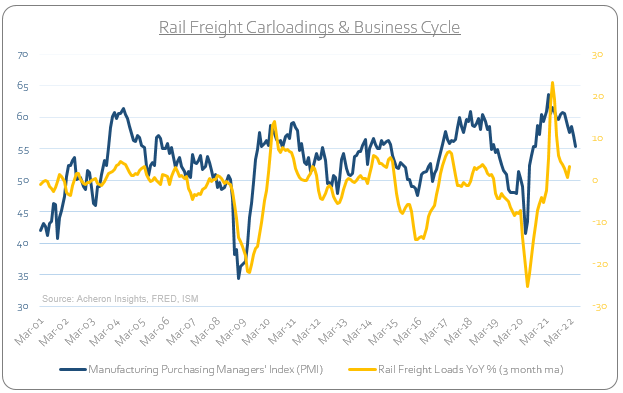
And freight shipments.
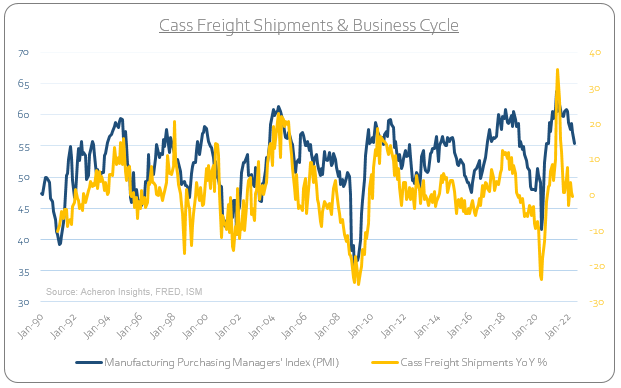
Along with global export activity, all of which are suggesting an immediate material slowdown in growth is a significant probability.
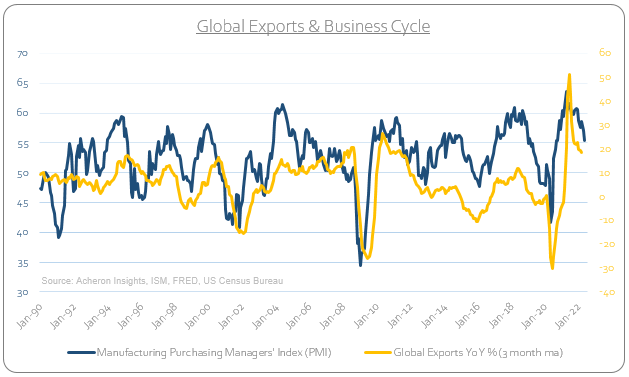
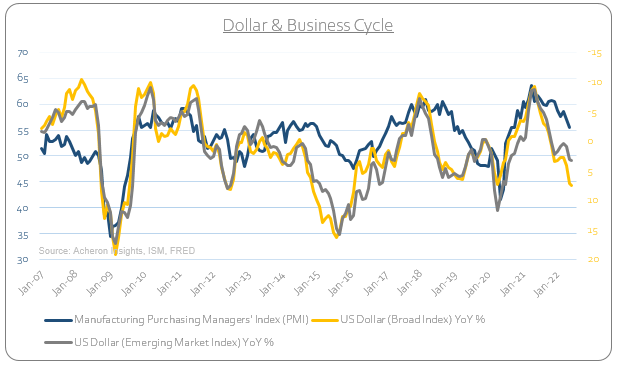
Furthering these dynamics is the recent strength in the dollar. A meaningful move higher in the dollar that we have seen in the past 12 months is akin to a weapon of mass destruction for global growth. Regardless of your long-term view of the dollar, it remains the world’s reserve currency and be the ultimate barometer for global growth, a dynamic particularly painful for many emerging market economies. A strong dollar is a significant drag on corporate profits, net exports and thus growth.
We can see that as a result of these dynamics financial conditions are becoming increasingly tighter, a measure which in itself tends to provide a solid short-term lead on the growth cycle (proxied below by the Goldman Sachs financial conditions index). Once again, the outlook for growth in the short-term is clearly challenged.

Source: Frederik Ducrozet
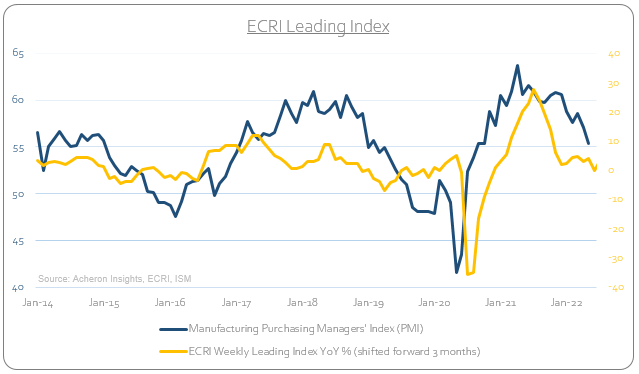
And finally, the Economic Cycle Research Institute Weekly Leading Index also continues to move lower in rate-of-change terms, an indicator that tends to lead the business cycle by two to three months.
What we can ascertain from both the direction of the longer and shorter leading indicators is there is still much further potential downside ahead for both the business cycle and risk assets in the months ahead. These trends are very much being confirmed by the price action of financial assets.
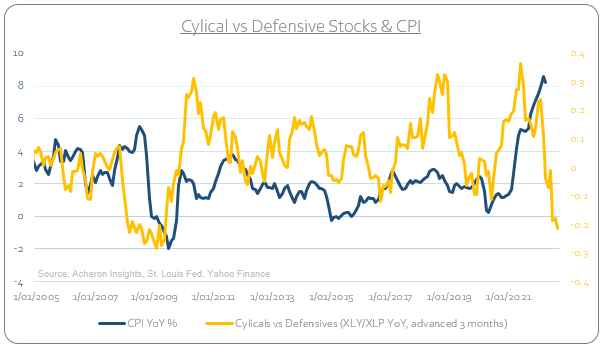
Indeed, we can see both the cyclicals vs defensives and high beta vs low beta stock ratios confirming market participants are very much beginning to price in a significant slowdown.
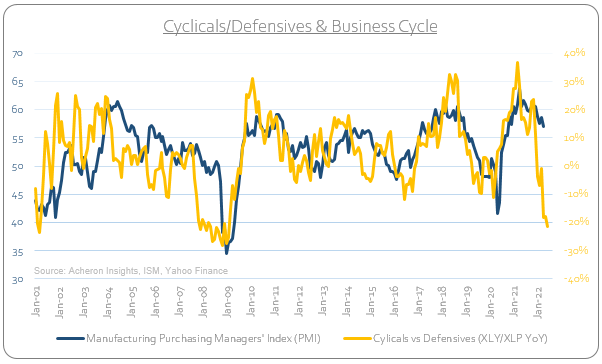
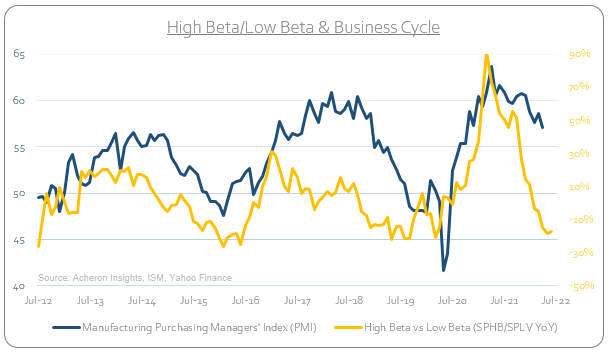
Whilst both ratios are clearly indicating the PMI is set to fall significantly in the months ahead, the concern here is these type of pro-cyclical ratios tend to remain suppressed until we see an upturn in growth itself, of which none of the leading liquidity or growth indicators are suggesting is imminent. Accordingly, risk-off remains the message of the business cycle for investors in the months and quarters ahead.
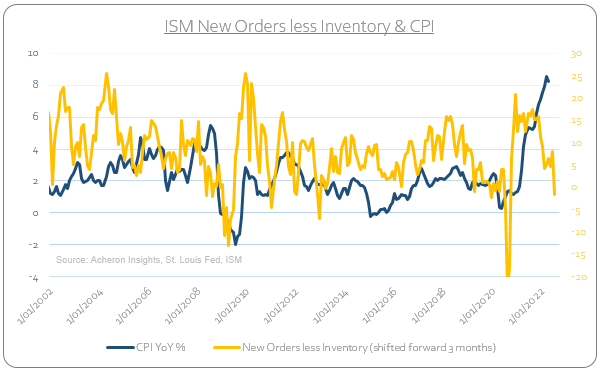
Turning now to inflation, we continue to see signs that not only has inflation peaked but a deceleration in the rate-of-change in inflation is becoming increasingly likely in the second half of 2022. The ISM New Orders and Inventory spread has been signaling this for some months now.
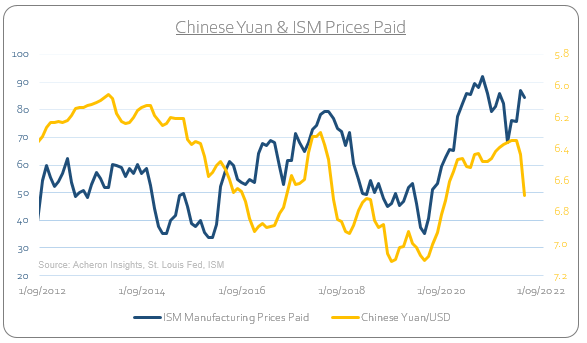
As is the recent weakness of the Chinese yuan, an important consideration as this will help alleviate manufacturing input price pressures and allow the US to export some of their inflation, at least to some extent.
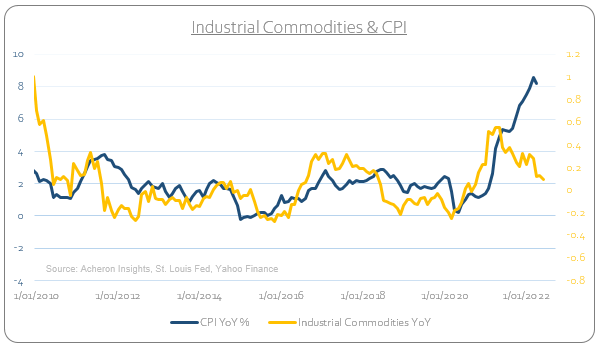
This is being echoed by the price movements of industrial commodities, being one of the areas of the commodity market most closely tied to the growth cycle and whose price movements of late are less subject to supply side constraints but rather economic activity.
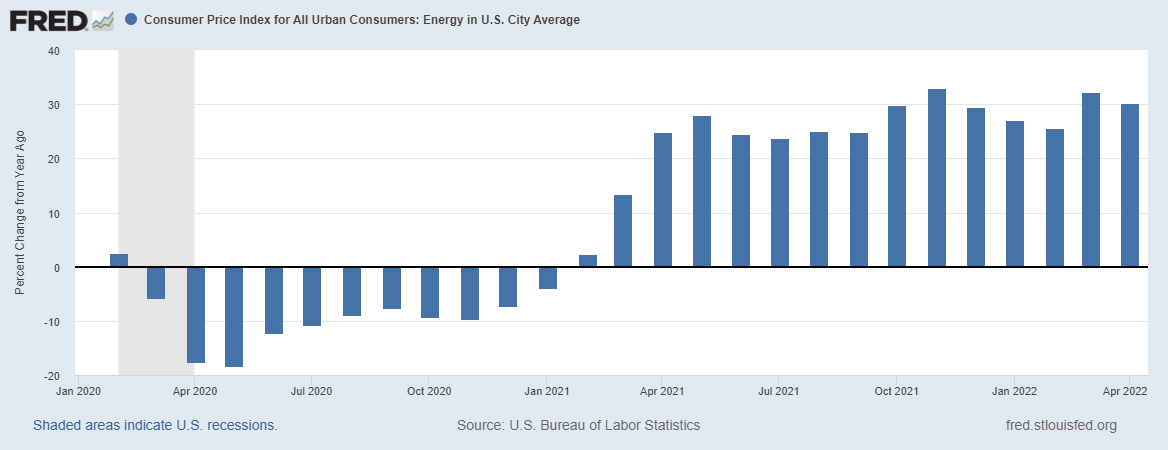
Even if energy and food prices continue higher, it is the rate-of-change that matters from a CPI perspective and the base effects are now firmly working in reverse, given the huge year-over-year changes we saw in Q2-Q4 of last year.
This is now very much beginning to be priced in by equity markets, as we see by again looking at the cyclicals vs defensives ratio.
However, we are unlikely to see a material move lower in CPI at any stage this year that could prompt the Fed to reverse course in their own tightening agenda. A Fed pivot in the near term is more likely to come as a result of a significant move lower in risk assets and a slowdown in the economy. Perhaps a deceleration in inflation could be the impetus for move higher in bonds.
From an asset allocation and risk management perspective, the message from the continued deceleration in growth on both a short and medium-term basis is clear. Investors will do well to be cautious buying tips with such an unfavourable macro backdrop in front of us. Indeed, depending on one’s risk tolerance and time frame, hedging your long positions or tactically adding short exposure continues to be a prudent strategy, as does taking profits on any rallies that ensue which are not supported by growth or liquidity. A continued underweight exposure to high-beta and pro-cyclical companies (i.e. retail, consumer discretionary, financials, small caps etc.) seems sensible for now.
The time to increase risk will come when the growth and liquidity cycles begin their next leg up. For now, risk management is key. This is the part of the cycle where investors should look to preserve capital.
For now, fade the rally.