All roads lead to gold
Updated 14 October 2020
I have been harking on for a while now regarding my bullishness on gold, the reasons for which are plenty. We in an era of unsustainable valuations in most major equity markets accompanied by the lowest interest rates perhaps ever. For your average mum and dad investors in the US looking to retire, your allocation to these overvalued equities is higher than it should be, whilst the “defensive” part of your 60/40 portfolio is fully exposed to assets offering “reward free risk”.
If you look at any decent valuation metric or sentiment indicator that has historically been a solid predictor of future returns, they are all telling a similar story. One such metric for forecasting US equity returns is the price/EBITDA ratio for the S&P 500:

Based on this simple valuation ratio, should the historical relationship hold (which it should under normal market conditions), we are likely to see negative returns over the next 10 years.
The long term outlook for stocks and bonds is not favourable, if you are relying on these assets to sufficiently support your retirement then you better hope the Fed keeps their money printer churning. Indeed, there is a massive demographic headwind coming for developed economies, the baby boomers are ready to retire and as they do, they will have no choice but to sell their assets. This leaves the Fed with little choice but to attempt to step in and prop up risk assets for as long as they can, which inevitably leads to money printing which inevitably leads to gold. This dynamic is borne by the US alone, Europe, Australia and almost all developed economies have similar demographic profiles and as such their respective central banks will likely have no choice but to do the same.
While we have enjoyed a very nice run in precious metals over the past couple of years, particularly over the past month, the long term fundamentals remain as bullish as ever.
If you look at the gold price relative to the total US money supply (as measured by M2), we are still hovering around the lowest point in 15 years. This ratio went up almost fourfold during the previous gold bull market from the early 2000s, and thus if history were to repeat itself a fourfold increase from the current levels would take this ratio to the levels we saw during the inflation driven gold bull market of the 1970s/80s. I am unsure if we will see the inflationary tailwind for gold this time around, however, I would think the roughly 650% price increase we saw during the 2000s bull market is a possibility, which would imply a gold price in excess of $10,000 USD per ounce over the next decade. Again, whilst such a return may be unrealistic, even a 2x increase in the price over the coming years provides a far greater risk/reward tradeoff compared to what’s on offer by US equities or fixed income.
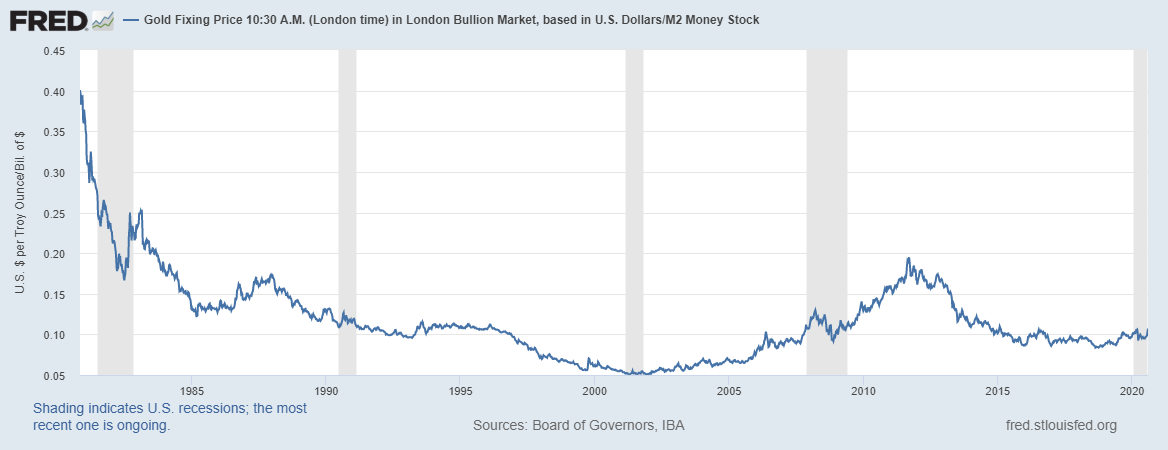
Source: St. Louis Fed
A comparison of the gold price relative to the S&P 500 paints a very similar picture.

Source: StockCharts.com
What is interesting about this chart is how equities relative to gold peaked in late 2018 (inverse of the above), and since then have been making lower highs. Whereas equities measured in US dollars have continued to make higher highs. To me, this says more about fiat currencies losing their value relative to gold than anything else. What's more, gold relative to equities has been in a clear uptrend since late 2018.
Indeed, the market has become well aware of these facts over the past few months and as a result the extreme bullishness of investors has lead me to reduce my gold and precious metals positions significantly, of which I wrote about recently. Fortunately, the past week has seen a long overdue correction, leading to a roughly 10% pullback in gold, silver and the miners. No doubt I was lucky to have reduced by position at the short term top. It is indeed better to be lucky than to be smart.
On the daily chart we can see gold fell back below its upper trend line to find support at its lower trend line prior to finishing the week at its 38.2% Fibonacci retracement from its prior low. A break above this resistance could see gold shoot back up to its upper trend line, roughly equating to a price of around $2,050. A failure to break this resistance level could see a further period of consolidation prior to making another leg higher. I tend to believe we are more likely to see the latter outcome for reasons I will explain below.
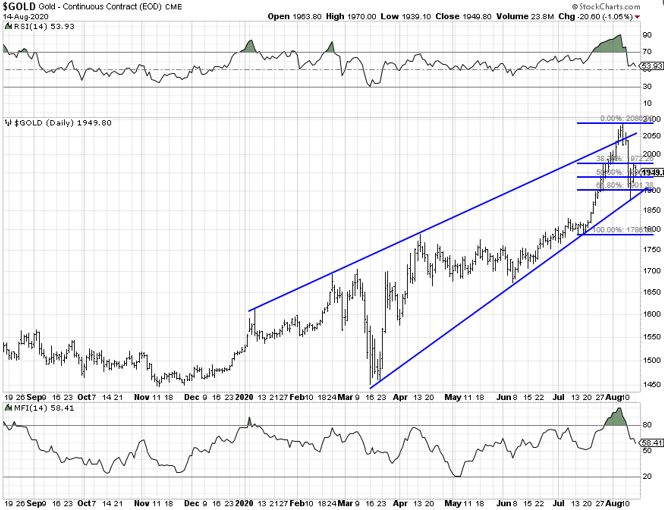
Source: StockCharts.com
Such pullbacks are good outcomes and represent further buying opportunities during bull markets. However, I believe there are a number of shorter-term headwinds for gold that really need to dissipate before it can continue its bull run in earnest. Firstly, sentiment towards the miners (as measured by the bullish percent gold miners index) remains at a fairly elevated level. Whilst the pullback has seen this index move down from its maximum value of 100% to around 75%, I would love to see a further washout of sentiment in this index that has historically preceded big upward moves. A drop to the 50% mark would be pleasing.

Source: StockCharts.com
Furthermore, the commitment of traders reports shows the small speculators are still heavily net long in the futures market (not pictured). From a purely technical standpoint, we have just triggered a weekly DeMark 9-13-19 Sequential Sell Signal, suggesting a period of further consolidation may be in order.

Source: TradingView.com
Fundamentally, we may be seeing gold react to the recent upward move in real interest rates. Whilst real rates remain negative, the gold price tends to track the movement in both actual and implied real rates fairly closely. We saw a spike upward in real rates earlier this year as inflation (as measured by core CPI) fell faster than interest rates. We have seen another upward spike in real rates as CPI continues to fall. Implied real rates are yet to follow suit which may be bearish.

The deflationary pressures of a recession will continue to be the prevailing force until we see the reflationary recovery. Indeed, if GDP continues its predictive abilities as a leading indicator for CPI (YoY GDP leads YoY core CPI by about 12 months) we are likely yet to have reached this point. Unless interest rates can match the fall in CPI, this dynamic certainly represents a headwind for gold and implied real rates alike. It is worth noting however thatn real rates remain negative and whilst they do, gold will no doubt benefit.
Again, to be clear, I remain bullish on gold but am hesitant to go tactically further overweight until I am confident real rates will not rise too dramatically.
Update: 14 October 2020
I have recently slightly added to my physical gold (GOLD), silver (ETPMAG) and gold miners (MNRS) positions by about 0.5-1% respectively. I still believe we may see a continuation of this consolidation period over the coming months, however, I am happy to increase by core positions ever so slightly as we have seen a moderate pullback in sentiment and the beginnings of some potentially favourable technical setups. I am not ready to go overweight precious metals just yet, but will do so in due course. My long USD positions will also likely provide a hedge for my core positions should we see a further pullback for gold.